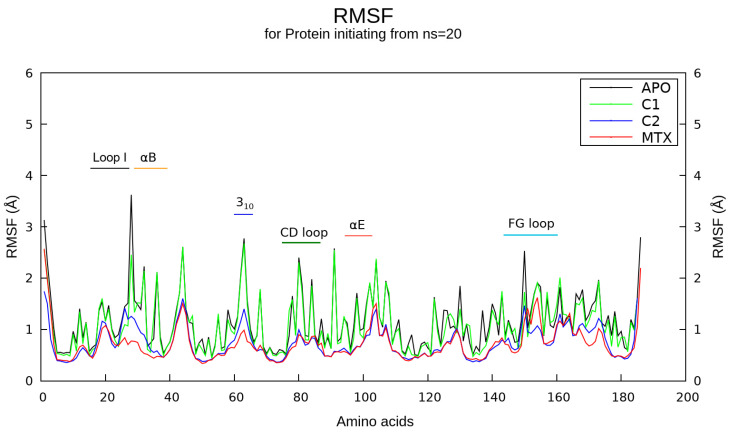
Figure 4.
Average RMSF plot for hDHFR in a bound and unbound form. The per-residue RMSF calculation for the free or unbound form, as well as the bound form complexed with C1, C2, and MTX, are depicted by continuous lines in a black, green, blue, and red color, respectively. Specific secondary structures are reported at the top of the graph.

