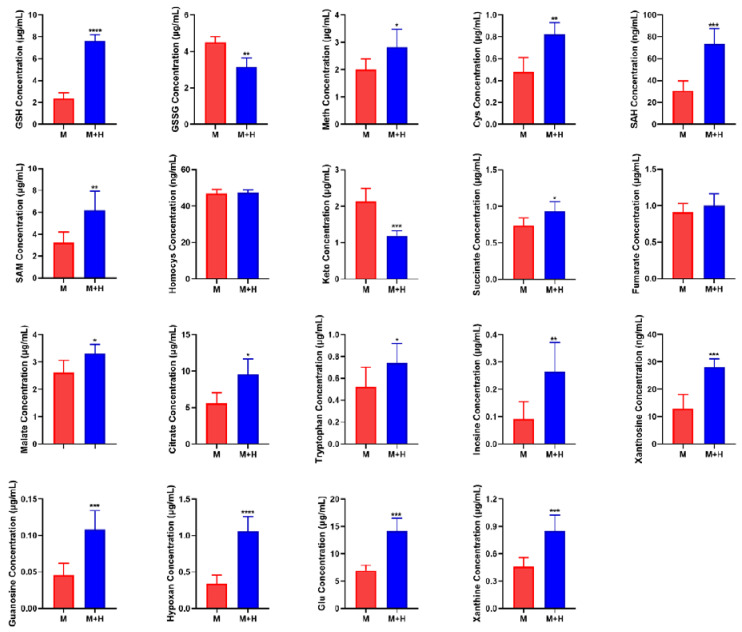
Figure 2.
Quantitative analysis of biomarkers. The data are expressed as mean ± SD (n = 6). * p < 0.05, ** p < 0.01, *** p < 0.001, **** p < 0.0001. Abbreviations are as follows: M represents MCF-7 cell single-culture group, M + H represents the co-culture group of MCF-7 and HUVEC cells. GSH, glutathione; GSSG, oxidized glutathione; Meth, methionine; SAM, S-adenosine methionine; SAH, S-adenosine homocysteine; Cys, cysteine; Hypoxan, hypoxanthine; Homocys, homocysteine; Glu, glutamate; Keto, α-ketoglutarate.

