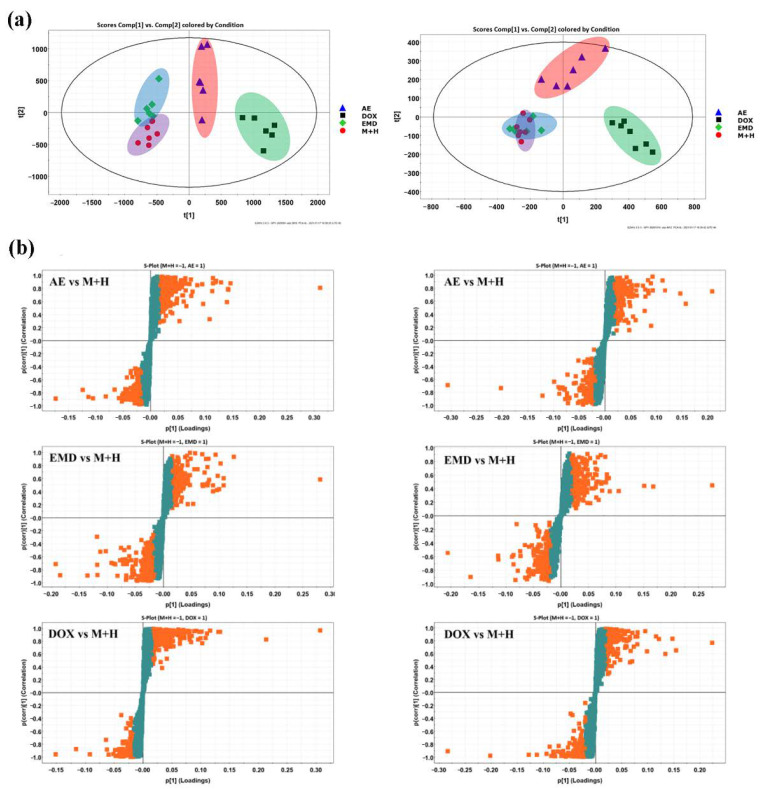
Figure 6.
PCA score plots of aloe emodin (AE), emodin (EMD), doxorubicin (DOX), and control group (M + H) in positive (left) and negative (right) ion mode (a). S-polts of metabolic profiling between aloe emodin (AE)/emodin (EMD)/doxorubicin (DOX) and control group (M + H) in positive (left) and negative (right) ion modes. The orange and green cubes represent metabolites of VIP>1 and VIP<1, respectively (b).

