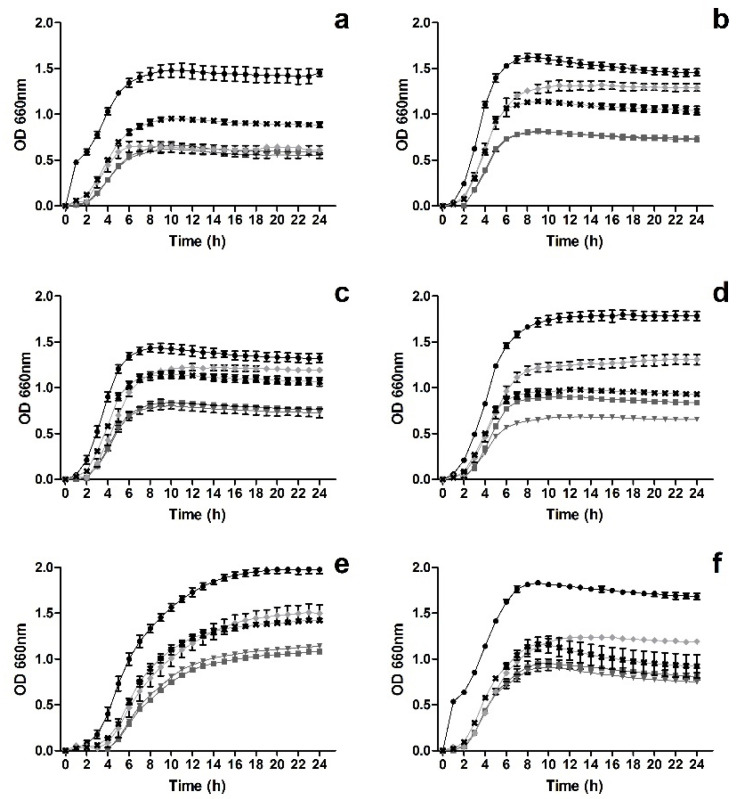
Figure 1.
Time inhibition curves drawn for MSSA R (a), MSSA CI (b), MRSA R (c), MRSA CI (d), MRSE (e) and VRSA (f) when exposed to M3Glu at 500 µg mL−1 (■), M3Glu at 250 µg mL−1 (◆), cM3Glu/NChA (▼ 500 µg mL−1 M3Glu with 100 µg mL−1 NChA), M3Glu/NChA (✖; 250 µg mL−1 M3Glu with 50 µg mL−1 NChA) and for the positive control (⬤).

