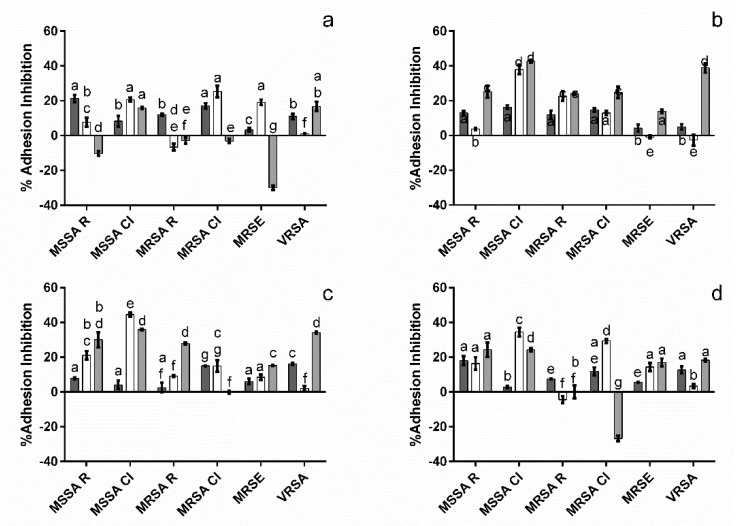
Figure 4.
Effect of M3Glu (500 µg mL−1 (a) and 250 µg mL−1 (b)), cM3Glu/NChA ((c); 500 µg mL−1 M3Glu with 100 µg mL−1 NChA) and M3Glu/NChA ((d); 250 µg mL−1 M3Glu with 50 µg mL−1 NChA) upon bacterial adhesion to PS (■), PS-rp (□) and PS-rp-ts (■). The different letters indicate the statistically significant (p < 0.05) differences between the bars.

