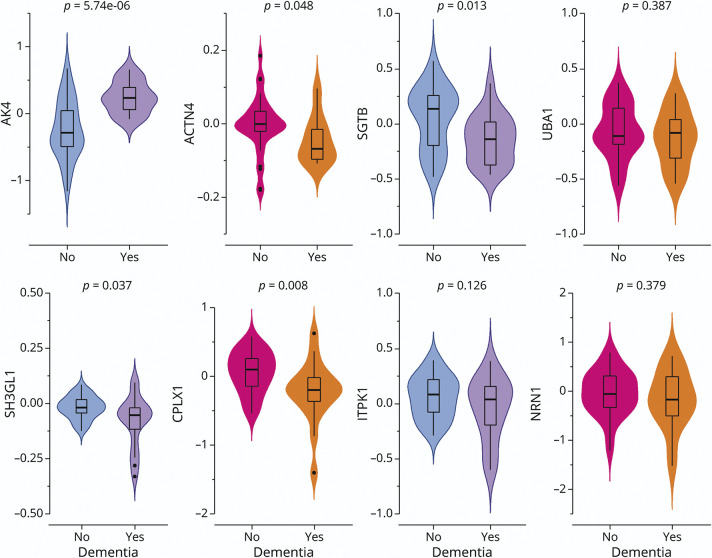
Figure 2. iN Proteins by Dementia Status.
The figure illustrates the difference in iN protein expressions by dementia status. The figure consists of 8 panels, each representing 1 specific candidate protein. Each panel is a violin plot that compares the iN protein expression level between the donors with and without dementia. The colored outer shapes show the distributions of protein expression (colored area), and the inner boxplots show the median, interquartile range, and potential outliers. The p values at the top were derived from the Student t tests. ACTN4 = alpha-actinin-4; AK4 = adenylate kinase 4; CPLX1 = complexin-1; iN = induced neuron; ITPK1 = inositol-tetrakisphosphate 1-kinase; NRN1 = neuritin; SGTB = small glutamine-rich tetratricopeptide repeat-containing protein beta; SH3GL1 = endophilin-A2; UBA1 = ubiquitin-like modifier-activating enzyme 1.

