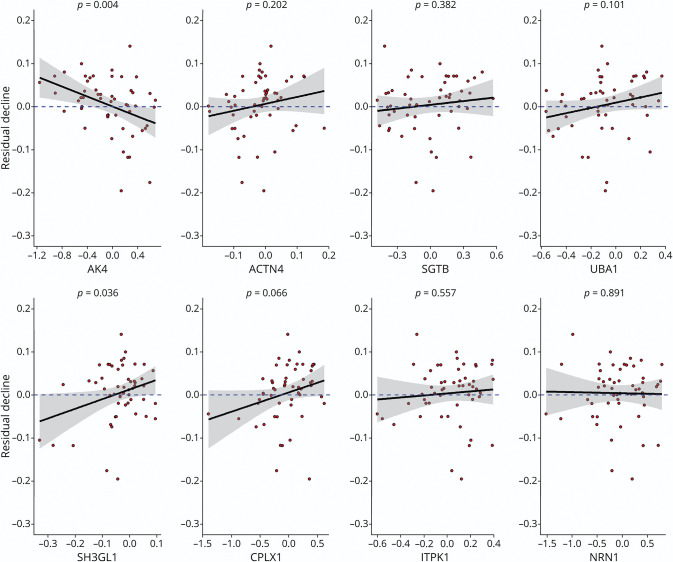
Figure 4. iN Proteins and Residual Cognitive Decline.
The figure illustrates the associations of iN protein expressions with residual cognitive decline. The figure consists of 8 panels, each representing 1 specific candidate protein. Each panel is a scatter plot. Candidate protein expression is on the x-axis, and the measure of residual cognitive decline is on the y-axis. Individual data points were overplotted with a regression line and the 95% confidence band. The dashed blue line represents the reference for no association. If the reference line is entirely covered by the 95% confidence band, it indicates that the association did not reach a nominal significance. Corresponding p values are shown at the top. ACTN4 = alpha-actinin-4; AK4 = adenylate kinase 4; CPLX1 = complexin-1; iN = induced neuron; ITPK1 = inositol-tetrakisphosphate 1-kinase; NRN1 = neuritin; SGTB = small glutamine-rich tetratricopeptide repeat-containing protein beta; SH3GL1 = endophilin-A2; UBA1 = ubiquitin-like modifier-activating enzyme 1.

