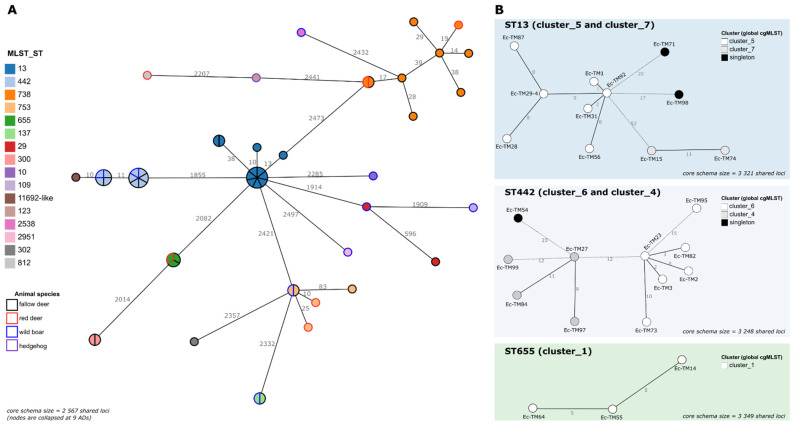
Figure 1.
The cgMLST analysis of pathogenic E. coli. (A) The global Minimum Spanning Tree (MST) was reconstructed, based on the core-genome of the 52 isolates (i.e., a sub-schema of the original 7601-loci wgMLST schema comprising loci called in all samples). Each circle (node) represents a single isolate or a cluster of isolates linked by ≤9 ADs (corresponding to the 0.34% threshold applied for cluster investigation). Each division in a node corresponds to a single isolate. Node colors reflect the ST (inner color) and the animal species (outer line color) of each isolate. Lines connect nodes with ADs above the applied threshold, with the numbers representing the ADs between nodes. (B) For each ST of interest (details in Table 3), an MST was constructed, based on a dynamic cgMLST analysis, enrolling a maximized ST-specific core-genome schema (i.e., a sub-schema comprising the loci called in all the isolates of the same ST). Only the MSTs corresponding to STs harboring clusters with >2 isolates are presented (see details for the others in Table 3). Each circle (node) represents a unique allelic profile, with colors reflecting the genetic cluster to which the isolate belonged in the global cgMLST analysis. Straight and dotted lines reflect nodes linked with the ADs below/equal, and above, the 0.34% threshold applied for cluster investigation, respectively. The numbers in the connecting lines represent the ADs between isolates. All MSTs were constructed using the GrapeTree MSTreeV2 algorithm implemented in the ReporTree pipeline (https://github.com/insapathogenomics/ReporTree (accessed on 6 October 2022)), using the chewieNS schema (https://chewbbaca.online/ (accessed on 6 October 2022)). Data visualization was adapted from the GrapeTree dashboard.

