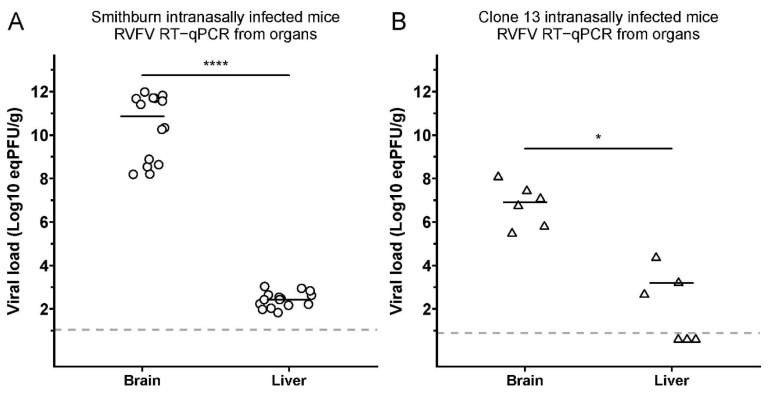
Figure 3.
SB and Cl.13 display a higher viral load in the brain than in the liver of IN-infected mice. The graphs report the viral loads (expressed as eqPFU/g) in the brains and livers of euthanized mice intranasally (IN) infected with SB ((A); n = 15) or Cl.13 ((B); n = 6). Mice were euthanized when moribund between D5 and D7 p.i. for SB and D6 and D13 p.i. for Cl.13. Negative sera are shown below these lines for each virus at half the value of their detection limits. Statistical analyses were performed using Wilcoxon-Mann–Whitney test (*: p < 0.05; ****: p < 0.0001).

