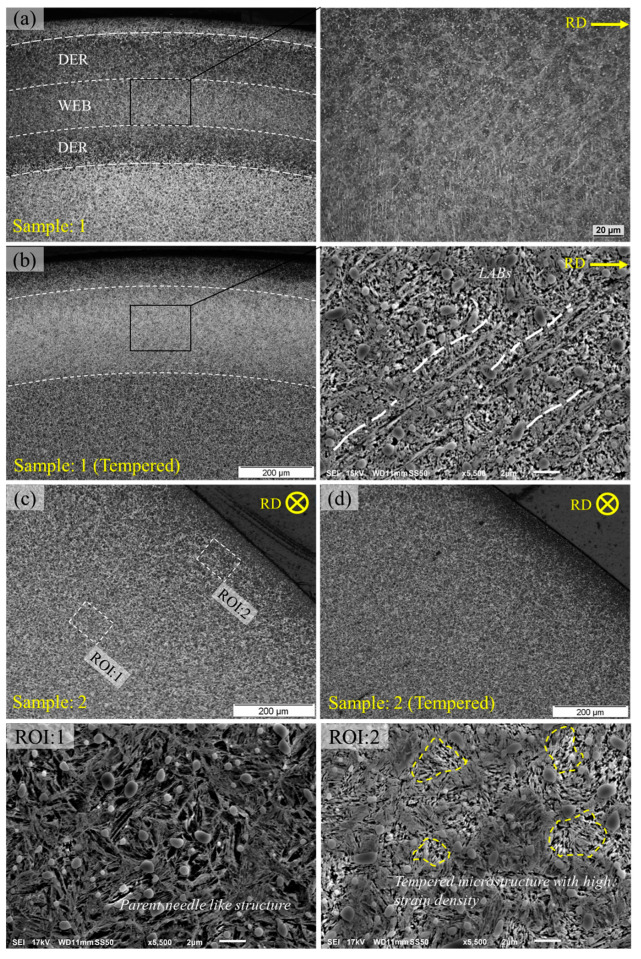
Figure 2.
(a) Subsurface micrographs obtained at 6 GPa, 100 °C, after 37 million rolling cycles. (b) Tempering of RCF-tested sample shown in (a). (c) Micrographs obtained at 6 GPa, 100 °C, after 0.02 × 10⁶ rolling cycles. (d) Tempering of RCF-tested sample shown in (c). ROI:1 and ROI:2 represent regions of interest for parent structure and RCF damaged area respectively.

