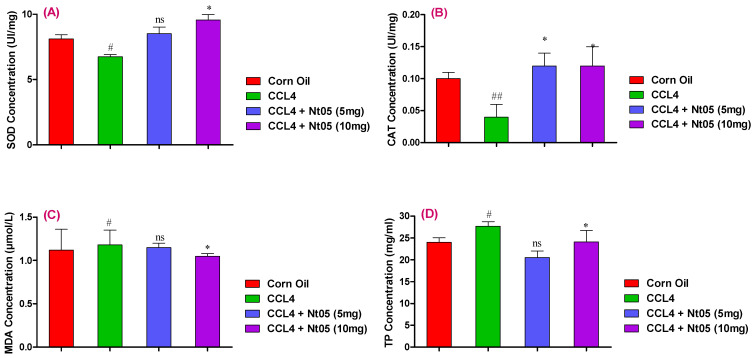
Figure 3.
The exhibited (A) SOD, (B) CAT, (C) MDA and (D) TP concentration values. Results presented as mean ± SD; 𝑛 = 5; significant difference: Corn oil compared to the CCl4 group—# p < 0.05 ## p < 0.01. CCl4 further compared to the sample treated groups—* p < 0.05. SOD: superoxide dismutase, CAT: catalase, MDA: malondialdehyde, TP: total proteins.

