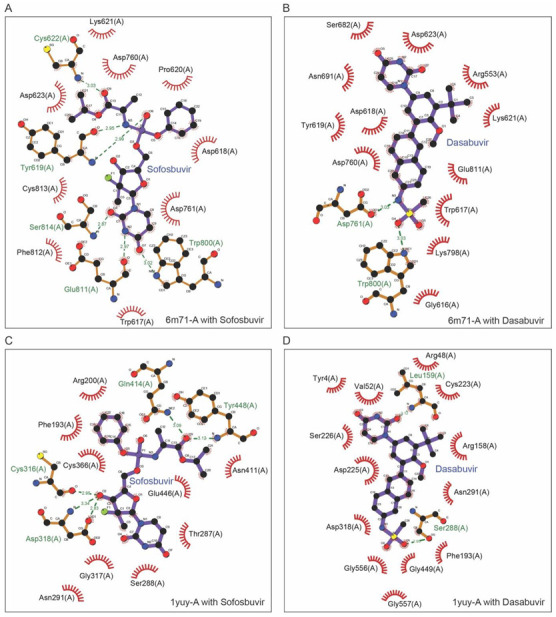
Figure 4.

Receptor–ligand interaction profiling. The interactions between receptors, i.e., Nsp-12 and NS5B and ligands, i.e., Sofosbuvir and Dasabuvir. The dotted green line represents hydrogen bonding while the residues shown participate in hydrophobic interactions. (A) Interactions between NSP-12 and Sofosbuvir. (B) Interactions between NSP-12 and Dasabuvir. (C) Interactions between NS5B and Sofosbuvir. (D) Interactions between NS5B and Dasabuvir.
