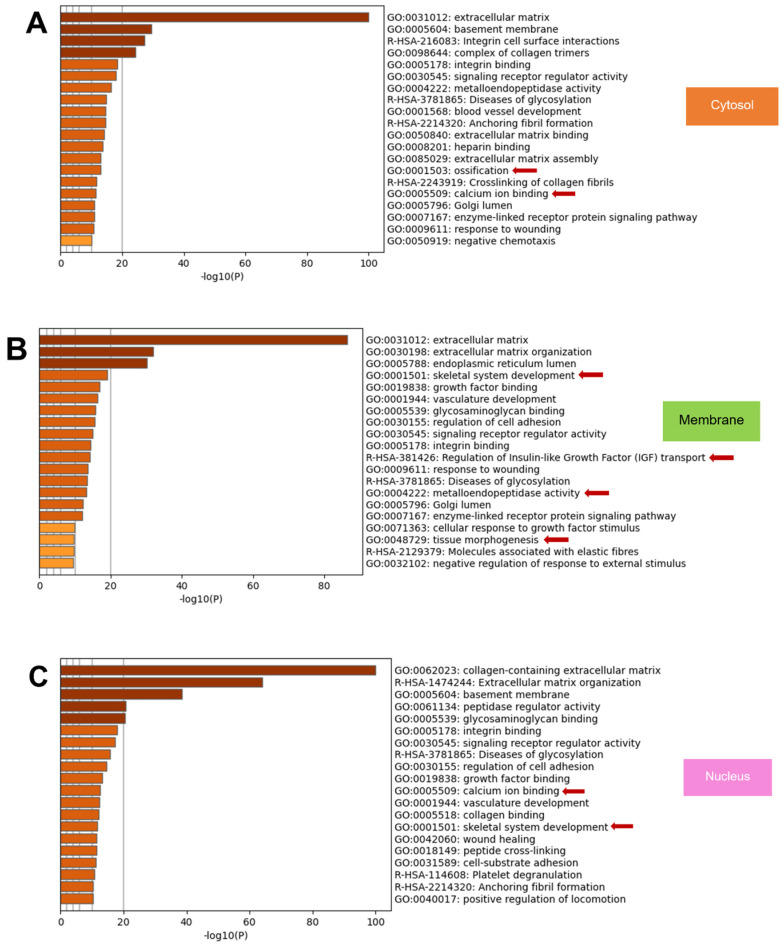
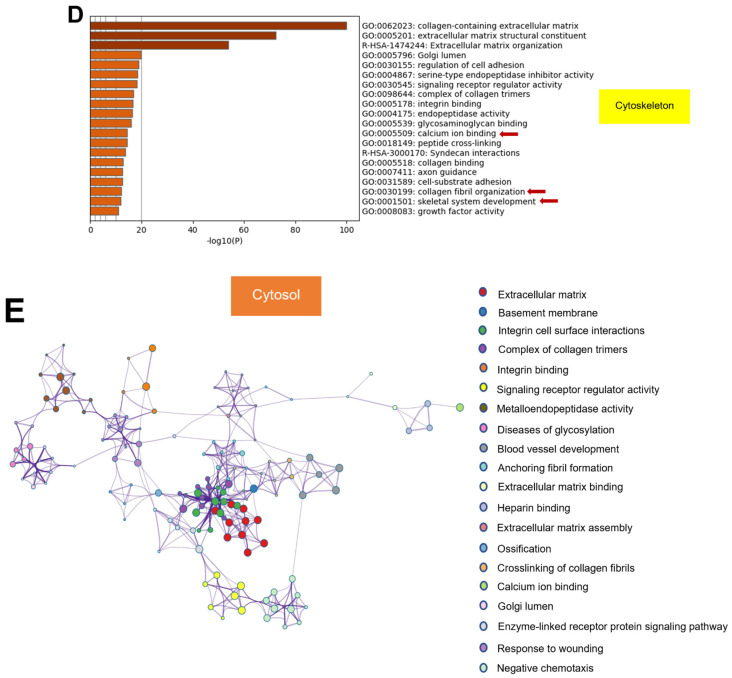
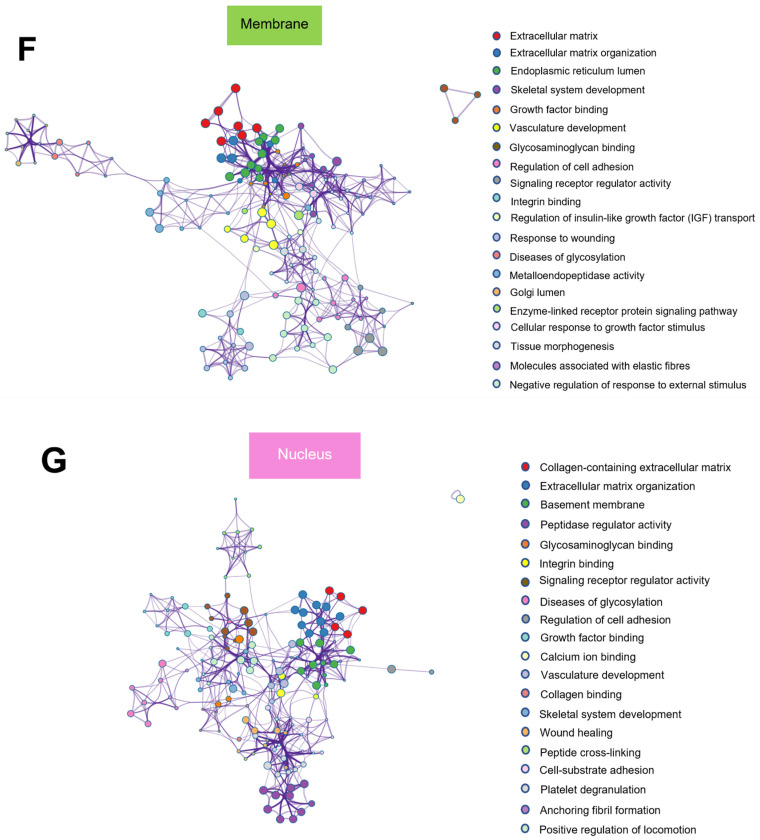
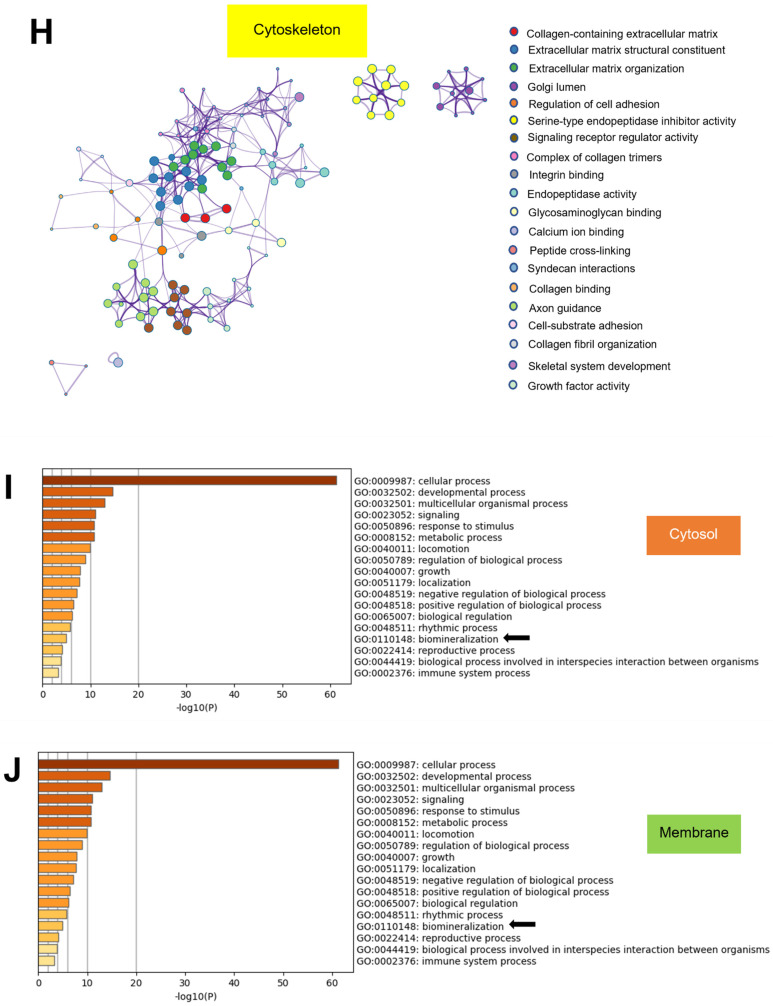
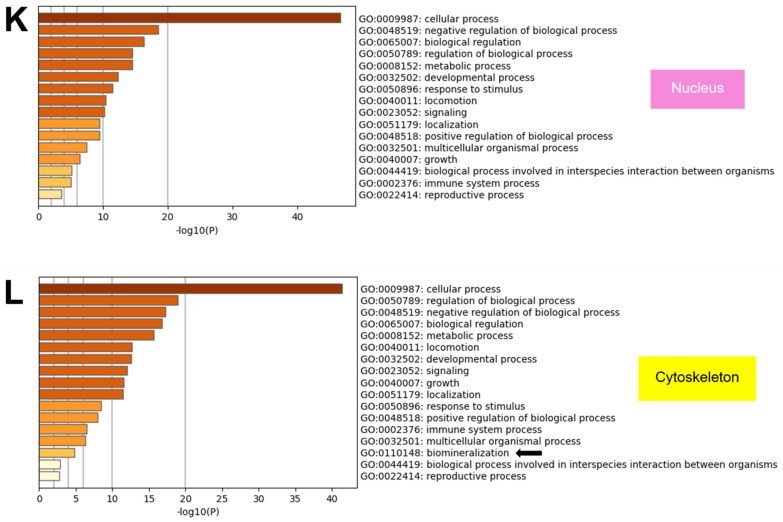
Figure 6.
The metascape gene list analysis report demonstrated the bar graph of the top 20 enriched terms across input gene lists, colour by p-values, in (A) cytosol, (B) membrane, (C) nucleus, and (D) cytoskeleton compartment. The terms associated with osteogenesis/osteogenic differentiation were specified with red arrows. To show the relationship among terms, network plots by cluster identification (cluster ID) of the (E) cytosol, (F) membrane, (G) nucleus, and (H) cytoskeleton compartment were visualised using Cytoscape. The top-level gene ontology (GO) is categorised by the biological process classified by cellular compartment (I) cytosol, (J) membrane, (K) nucleus, and (L) cytoskeleton. Black arrows indicated the biomineralisation which participated in osteogenesis/osteogenic differentiation. The analyses were performed using Metascape [32].

