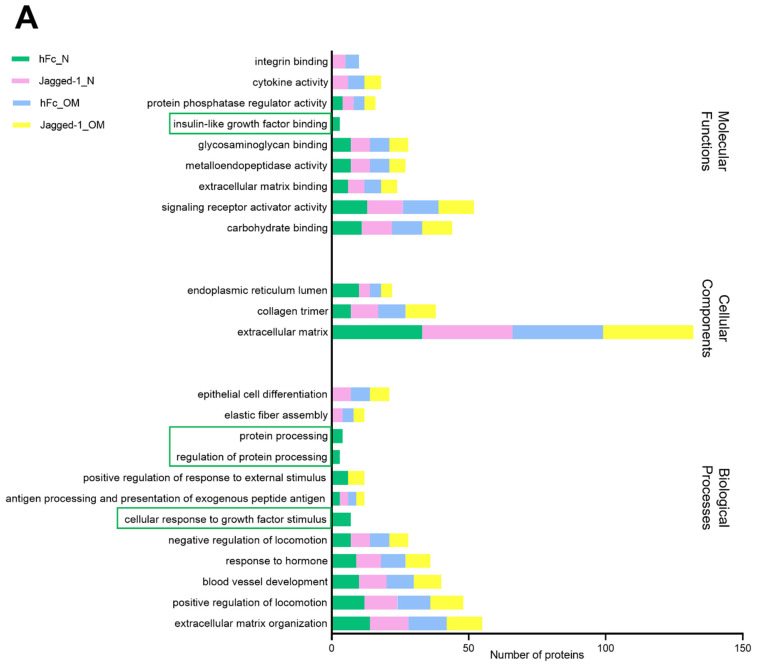
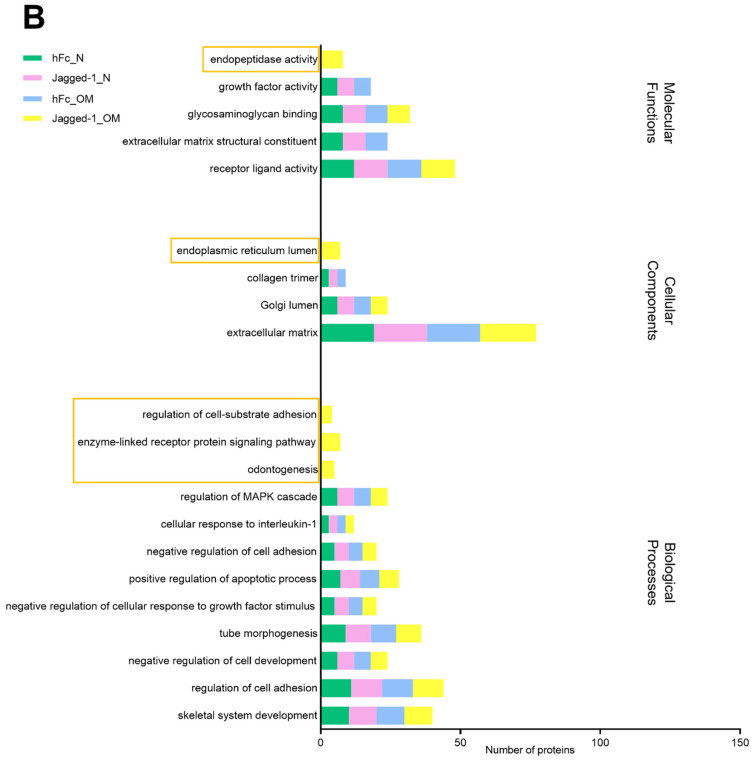
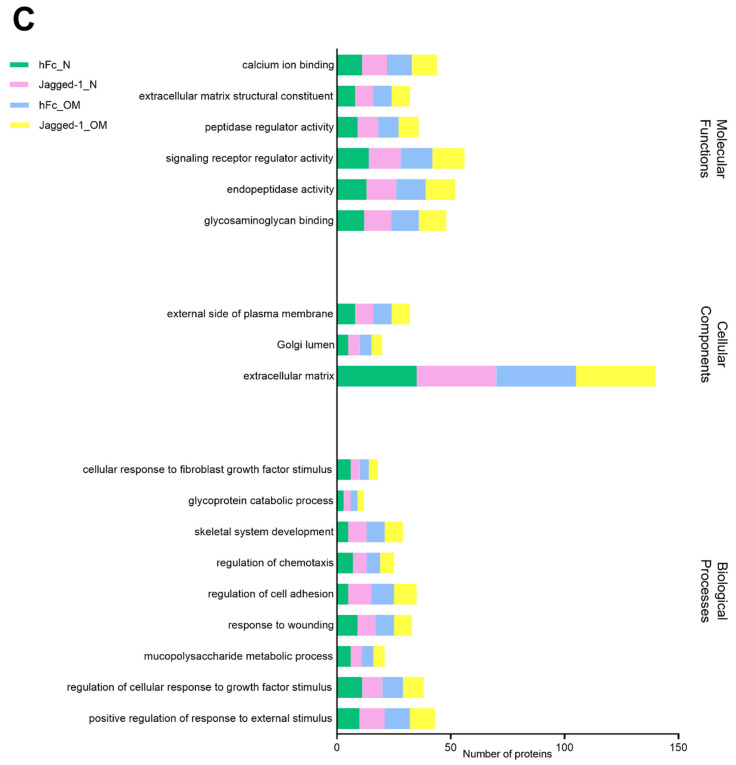
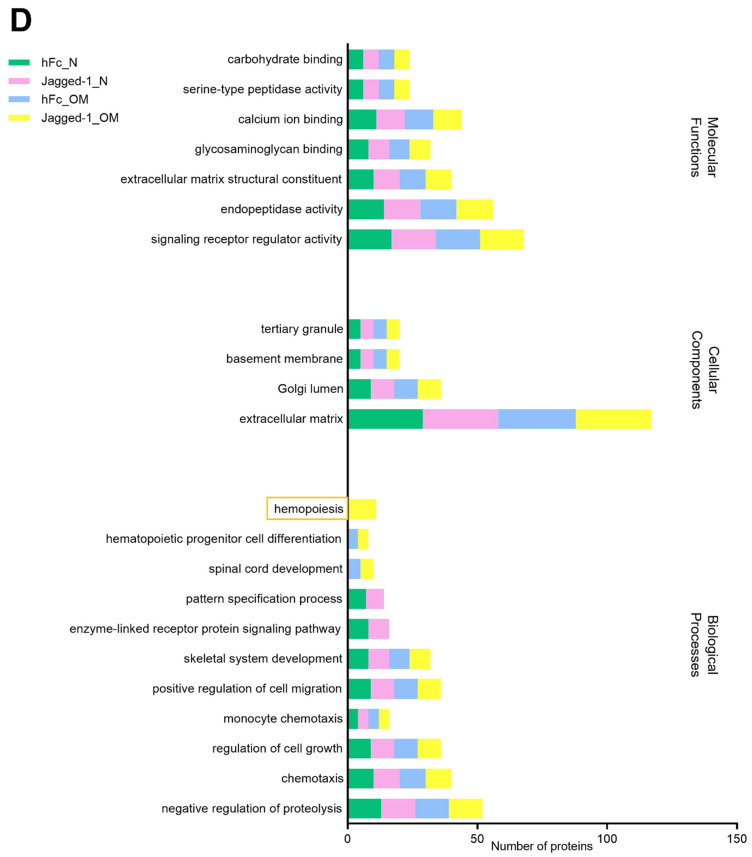
Figure 8.
Bar graphs showed the gene ontology in biological processes, cellular components, and molecular functions of (A) the cytosol, (B) membrane, (C) the nucleus, and (D) the cytoskeleton compartment, respectively. Unique proteins were specified in a rectangular shape. The analyses were performed using Metascape [32].


