Figure 8.
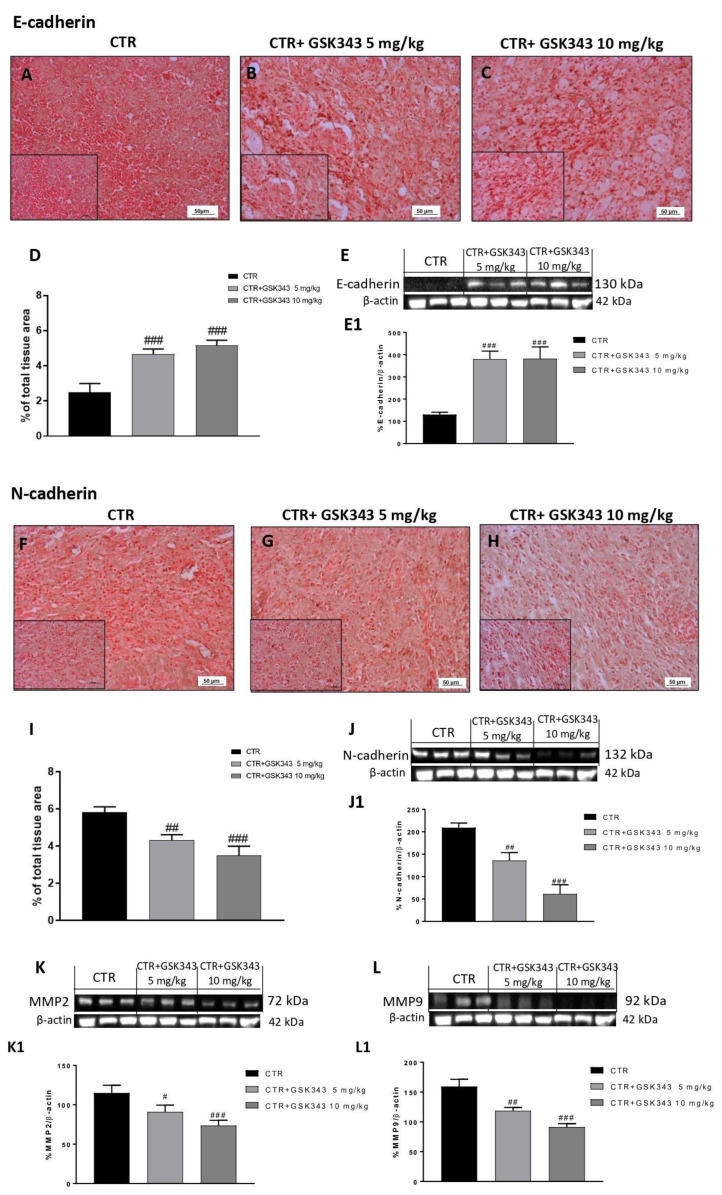
Effect of GSK343 on E-cadherin, N-cadherin, MMP2 and MMP9 expression in the U87-xenograft model. Immunohistochemical analysis revealed that GSK343 at doses of 5 mg/kg and 10 mg/kg significantly increased E-cadherin expression (B,C) compared to the control group (A). The data for E-cadherin was confirmed also by Western blot analysis (E). Furthermore, the treatments with GSK343 at doses of 5 mg/kg and 10 mg/kg (G,H) significantly reduced N-cadherin expression compared to the control group (F). The data for N-cadherin was also confirmed by Western blot analysis (J). The treatments with GSK343 at doses of 5 mg/kg and 10 mg/kg significantly reduced MMP2 and MMP9 expression compared to the control group (K,L). Sections were observed and photographed at 20x and 40x magnifications. (D) ### p < 0.001 vs. Ctr; (E) ### p < 0.001 vs. Ctr. (I) ## p < 0.01 vs. Ctr; ### p < 0.001 vs. Ctr; (J) ## p < 0.01 vs. Ctr; ### p < 0.001 vs. Ctr. (K) # p < 0.05 vs. Ctr; ### p < 0.001 vs. Ctr; (L) ## p < 0.01 vs. Ctr; ### p < 0.001 vs. Ctr.

