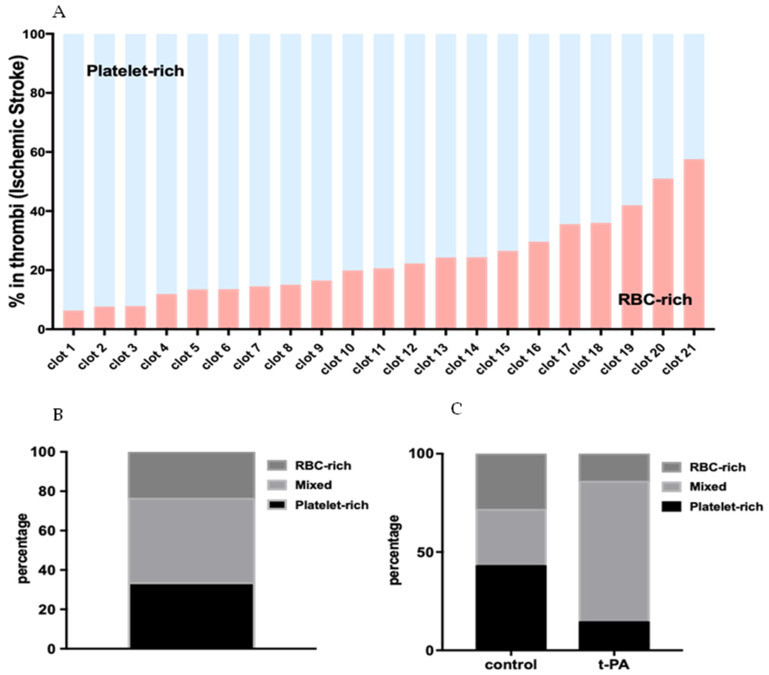
Figure 3.
Composition of the stroke thrombi. (A) Quantitative analysis of the stroke thrombi using H&E staining was performed and the percentage of RBC-rich areas (red) and platelet-rich areas (light blue) was determined. All the thrombi contain significant amounts of platelet-rich and RBC-rich areas. Individual thrombi differ in composition with some showing an abundance of platelet-rich areas while others an abundance of RBC-rich areas (n = 21, vertical bars). (B) Bar diagram showing the classification of stroke thrombi based on the percentage of platelet-rich and RBC-rich areas. The majority consisted of mixed thrombi. (C) Percentage of RBC-rich, mixed, and platelet-rich thrombi in control vs. group that received t-PA.

