Figure 5.
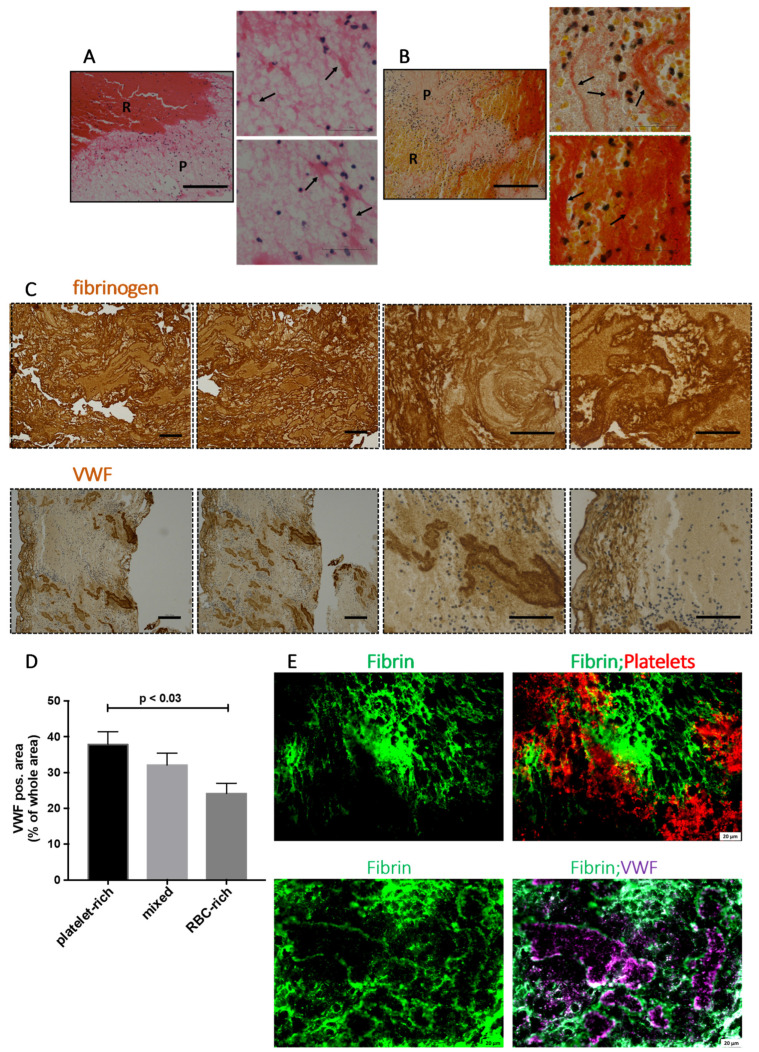
Platelet-rich areas show infiltrated platelets in dense fibrin networks lined with von Willebrand Factor (VWF). (A) Hematoxylin and Eosin (H&E) staining of AIS patient thrombi at low (left panel) and high (right panels) magnifications show profuse fibrin network (appearing light pink, black arrows) with heavily populated nucleated cells (blue) in platelet-rich (P) areas. Scale bars = 200 μm. (B) Martius Scarlet Blue (MSB) staining of stroke thrombi at low (left panel) and high (right panels) magnifications show dense fibrin network (appearing red) in platelet-rich (P) areas. More nucleated cells (blue) are seen in the platelet-rich (P) areas. Scale bars = 200 μm. (C) Immunohistochemical staining of retrieved stroke thrombi using antibodies specific to fibrin(ogen) (top panel) and VWF (bottom panel). Higher magnifications of the representative stainings are shown on the right two panels each. Outer edges show dense VWF staining whereas inside areas show discrete staining. Scale bars = 200 μm on the left four panels and 100 μm in right four panels. (D) Bar diagram showing the percentage of total VWF+ area in all three thrombi subgroups (platelet-rich, mixed, and RBC-rich). The data points represent mean ± SEM of the percentages. Two-tailed t-test (E) Immunofluorescence staining of stroke thrombi was used to visualize fibrin(ogen) (green), platelets (CD42b, red), and VWF (purple). A profuse fibrin network lined with VWF and infiltrated by platelets (white arrows) is seen. Scale bars are 20 μm. P: platelet-rich area; R: RBC-rich area.

