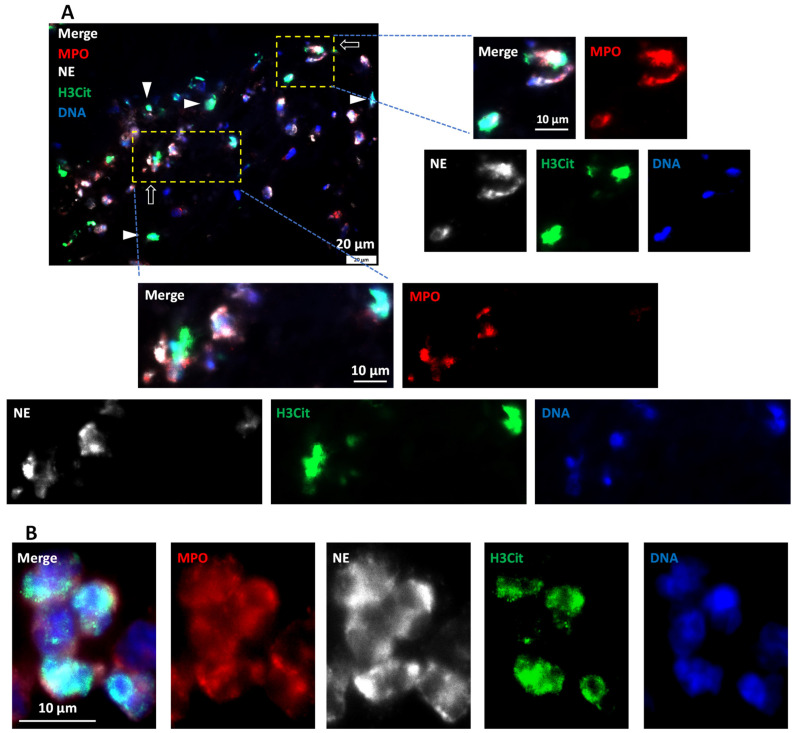
Figure 8.
AIS patient thrombi show NET formation in platelet-rich areas. (A) Representative immunofluorescent image of ischemic stroke patient thrombi stained for DNA (blue), and with antibodies against neutrophils (MPO, red, and NE, white) and citrullinated histone (H3Cit, green). Neutrophils are seen at different NET-forming stages (white arrows). Moreover, visible are extracellular NETs (white arrowheads) depicting complete NETosis. Scale bar: A: 20 μm and insets: 10 μm. (B) Representative ischemic stroke patient thrombi at higher magnification show NET-forming neutrophils with nuclear decondensation and marked with intracellular H3Cit staining. Scale bar: 10 μm.

