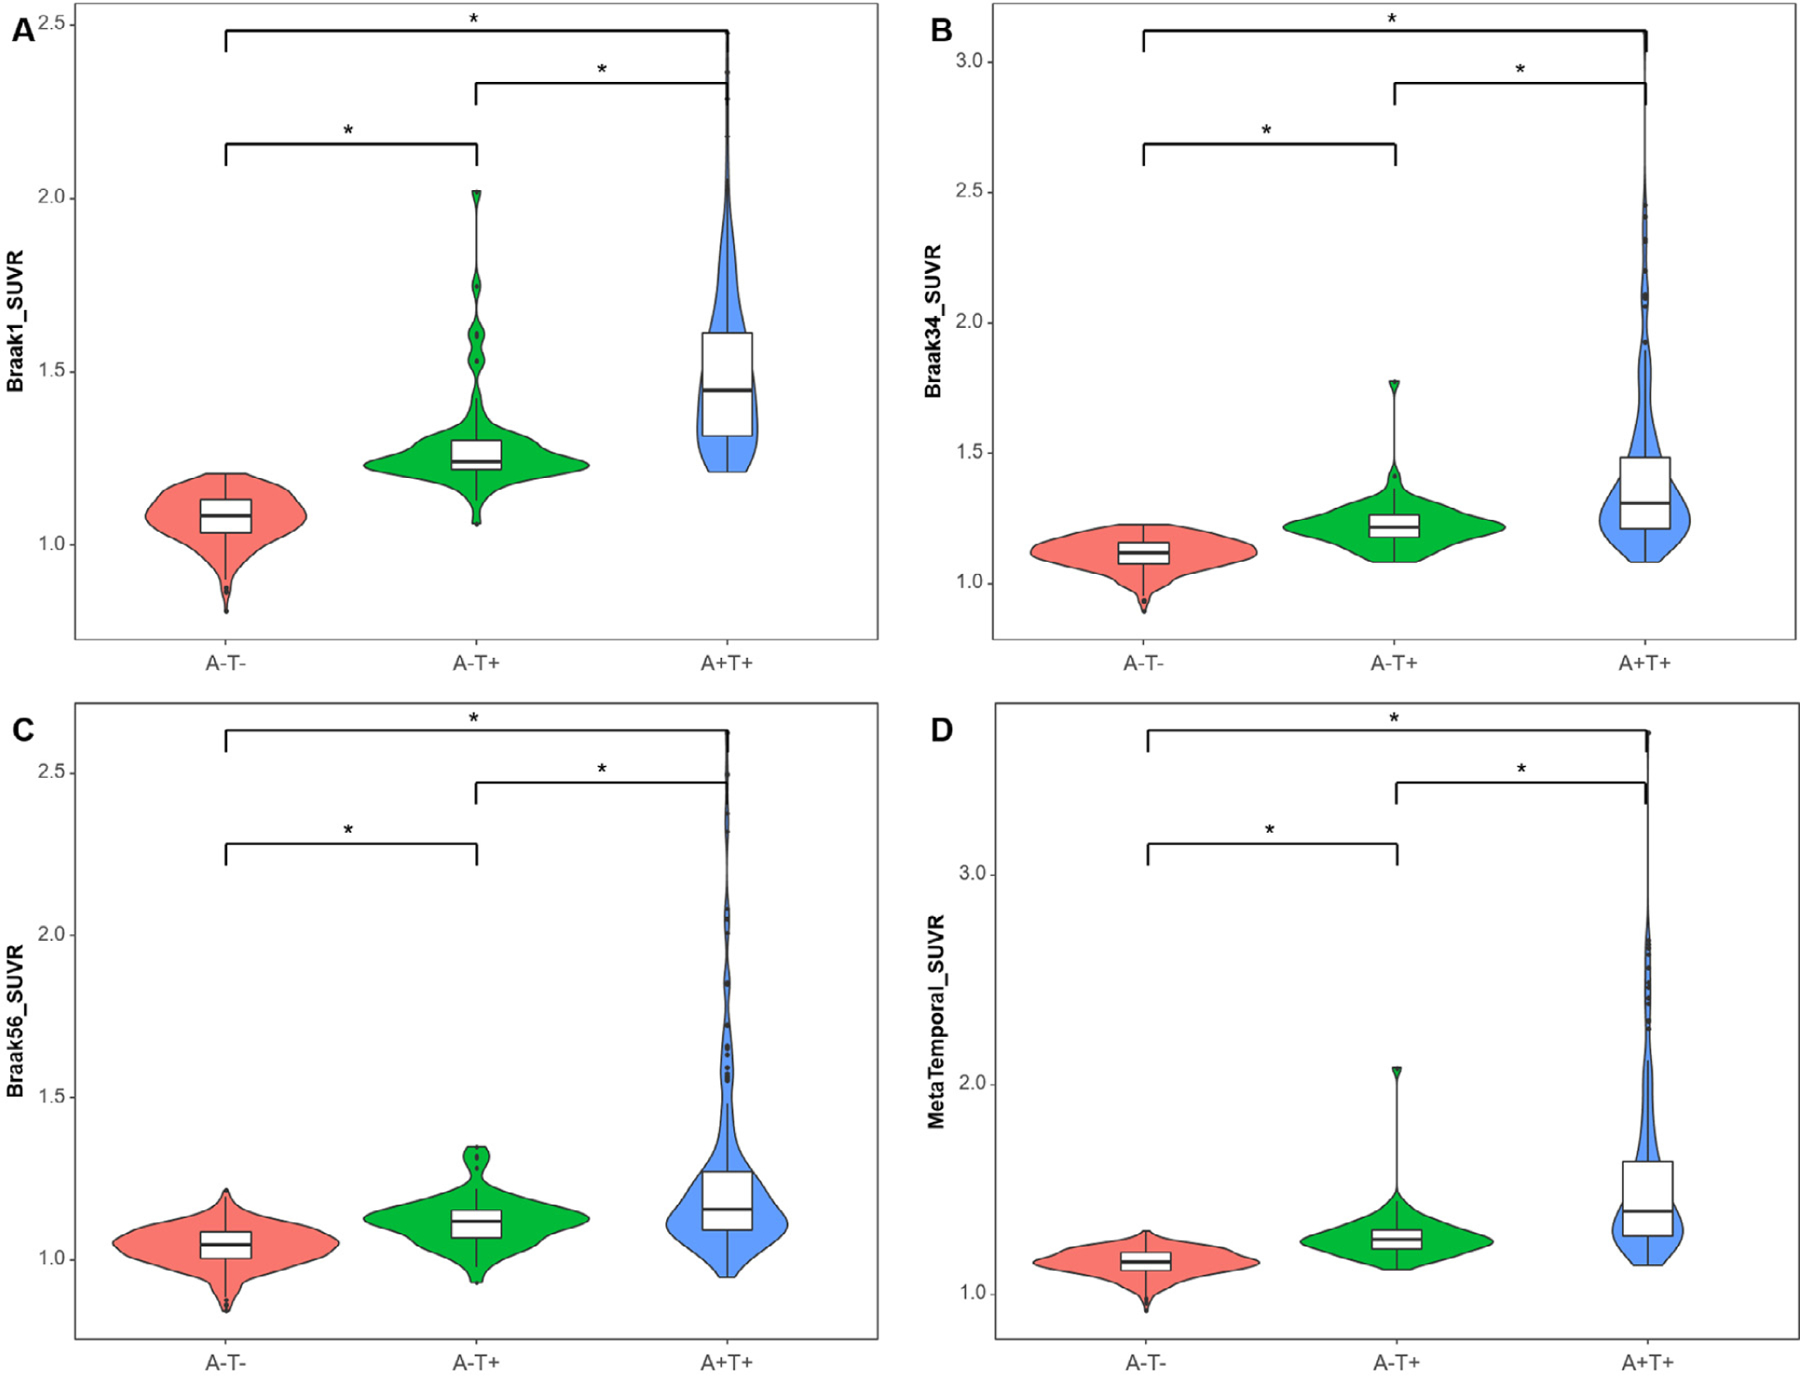
Fig. 1.

Tau levels by Braak stage among 316 A-T- individuals, 63 A-T+, and 182 A+T+ individuals. Violin plots and Boxplots represent tau SUVR in grouped regions of interest corresponding to Braak 1 (A), Braak 34 (B), Braak 56 (C), and Metatemporal ROI (D) by AT group. The Y-axis is a tau SUVR value in each Braak stage. Regardless of Braak stages, the A-T+ group shows an intermediate level of FTP SUVR between A-T- and A+T+ groups. Asterisk (∗) represents a statistically significant p-value (p < 0.001) in the analysis of covariance adjusted by age, sex, and diagnosis with Bonferroni correction. Abbreviations: FTP, 18F-flortaucipir; ROI, region of interests; SUVR, standard uptake value ratio.
