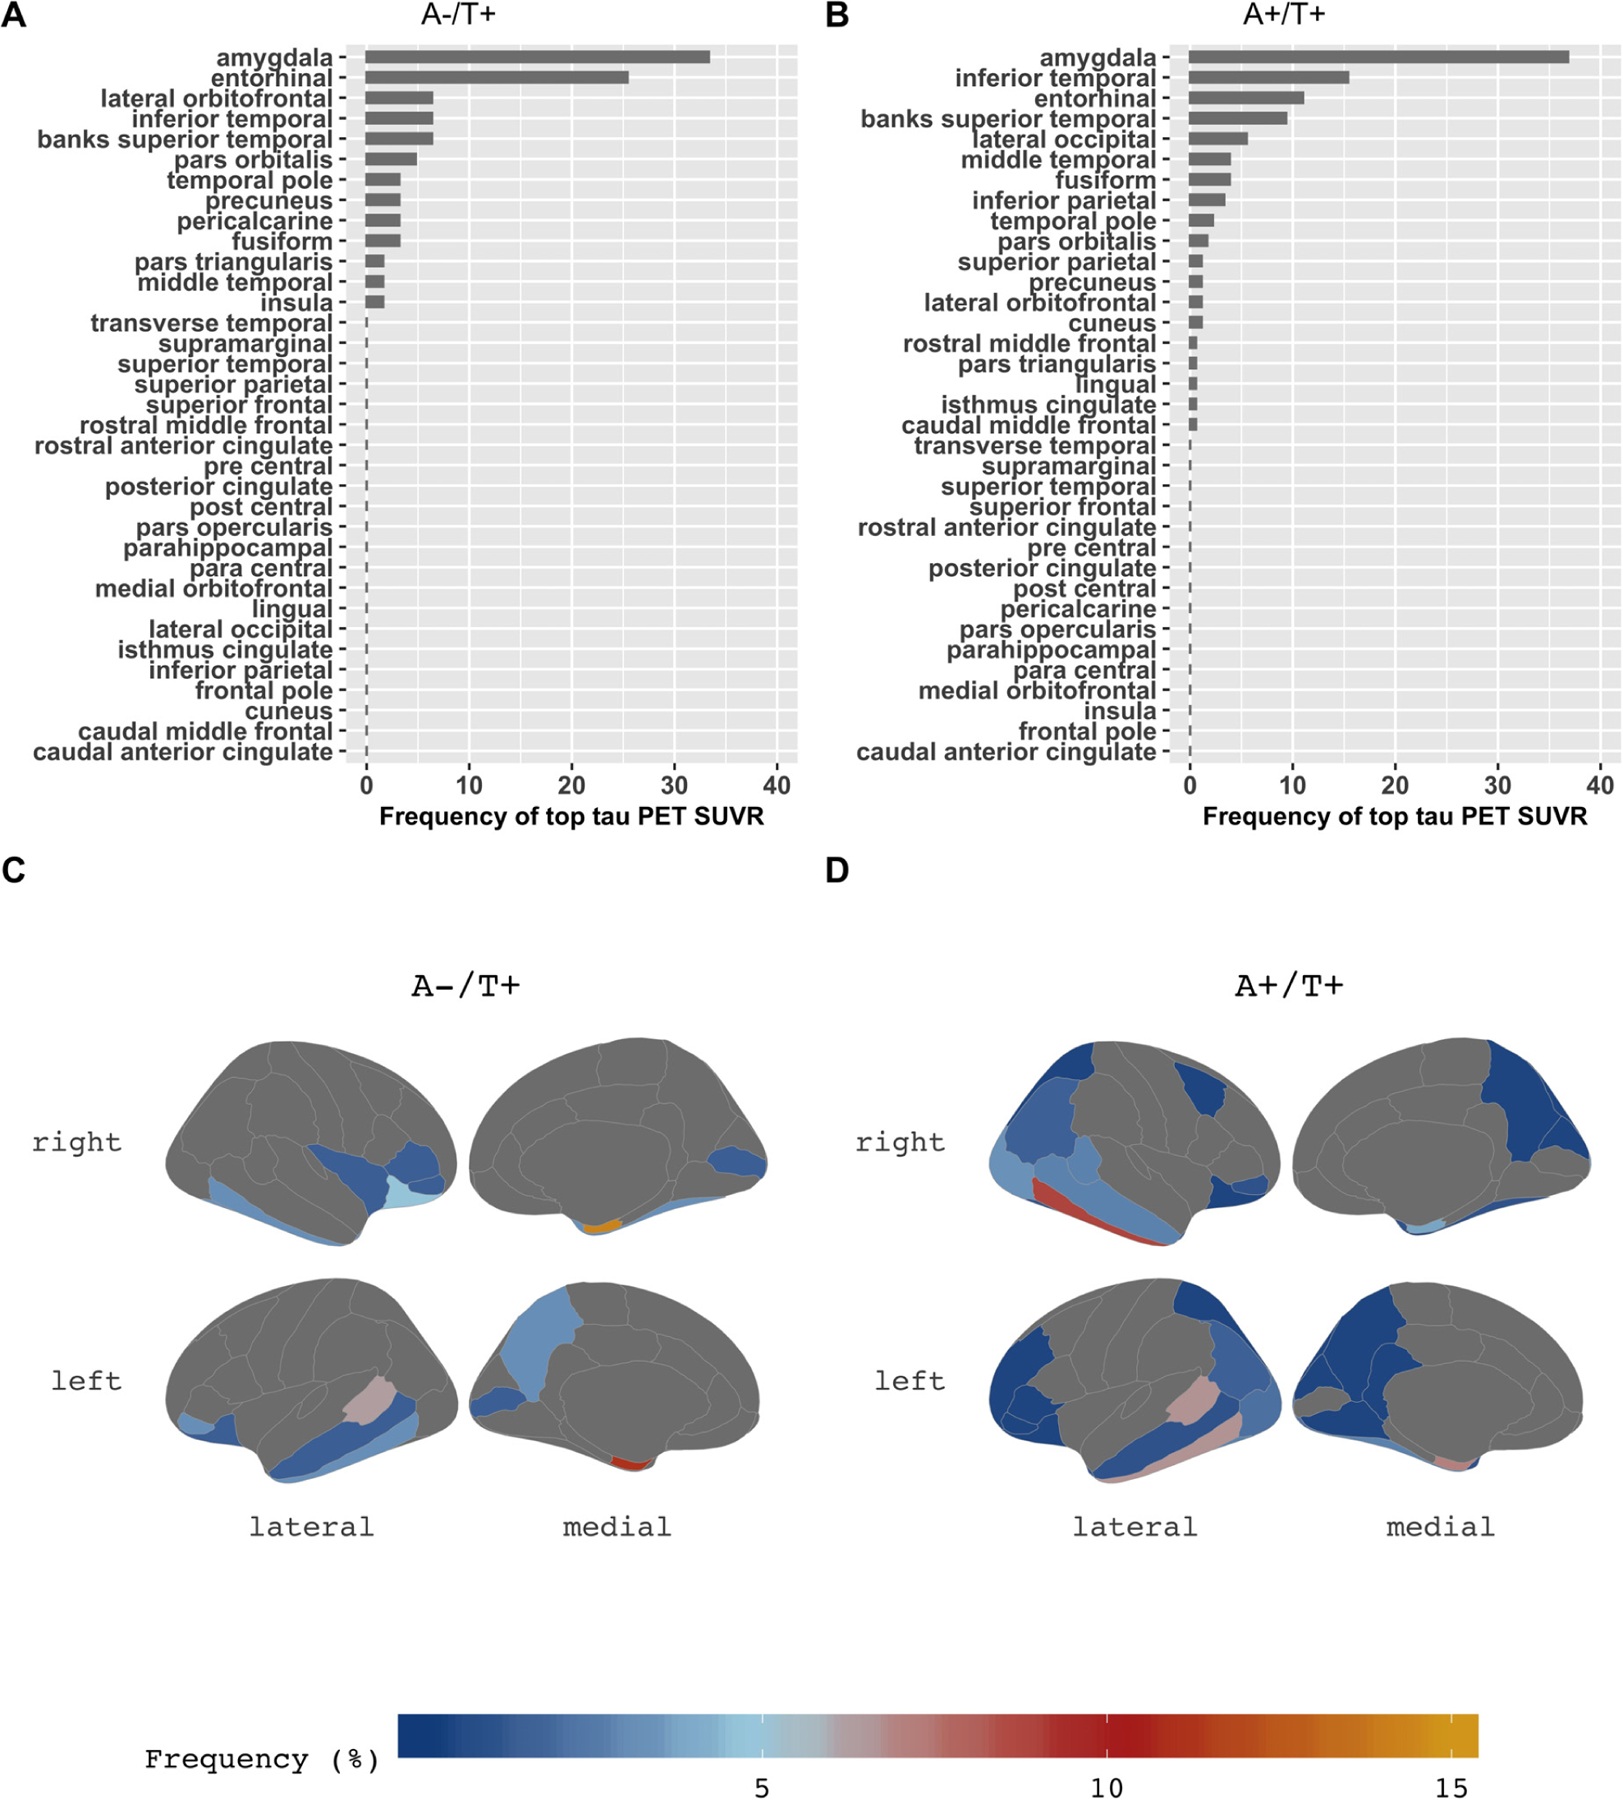
Fig. 3.

The topography of tau deposition. In the bar charts of the A-T+ group (A) and the A+T+ group (B), the X-axis is the percentage of frequency that each region appeared as the highest tau SUVR (averaged across hemispheres). Detailed asymmetry index in the regions of each group were presented in Suppl. Fig. 4. Amygdala is the highest area of tau deposition in both the A-T+ group and the A+T+ group. The brain maps (C, D) demonstrate the distribution of tau deposition according to the frequency coded in the color bar below. Compared to the A-T+ group (C), the A+T+ group (D) shows a more widespread distribution of tau deposition extending to parietal, frontal, and occipital lobes, but similar patterns showing amygdala, temporal and orbitofrontal lobes. Abbreviations: SUVR, standard uptake value ratio.
