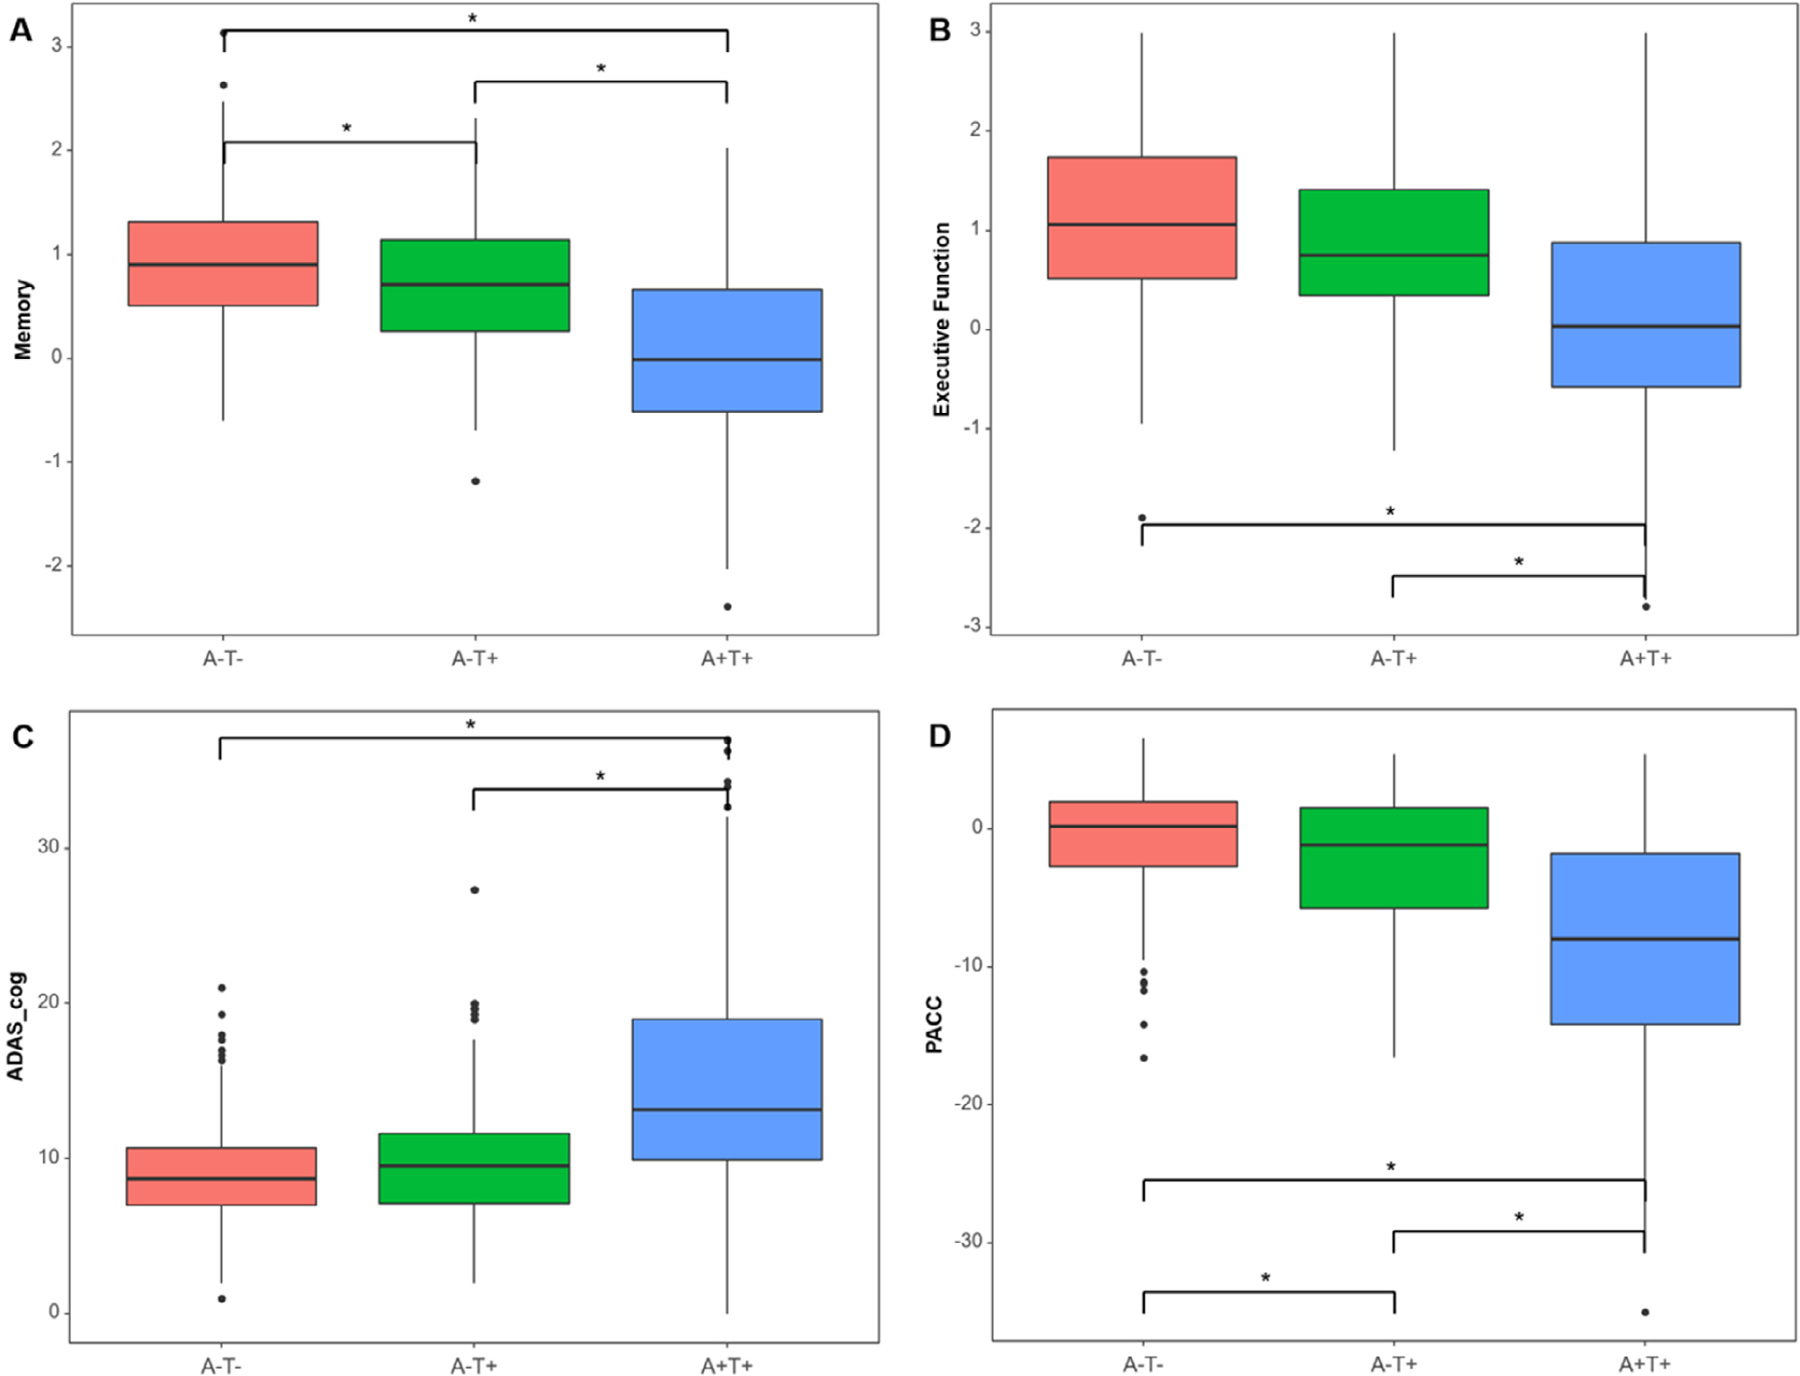
Fig. 4.

Cognitive profile comparisons among 3 groups. Boxplots represent (A) memory composite score, (B) executive function composite score, (C) ADAS-cog, and (D) PACC by AT group. The Y-axis is a normalized value (z-scores) of each cognitive measure. The cognition of the A-T+ group is intermediate between the 3 groups. Asterisk (∗) indicates a statistically significant p-value (p < 0.001) in the analysis of covariance adjusted by age, sex, and education with Bonferroni correction. Abbreviations: ADAS-cog, Alzheimer’s disease assessment scale-cognitive subscale; PACC, preclinical Alzheimer cognitive composite.
