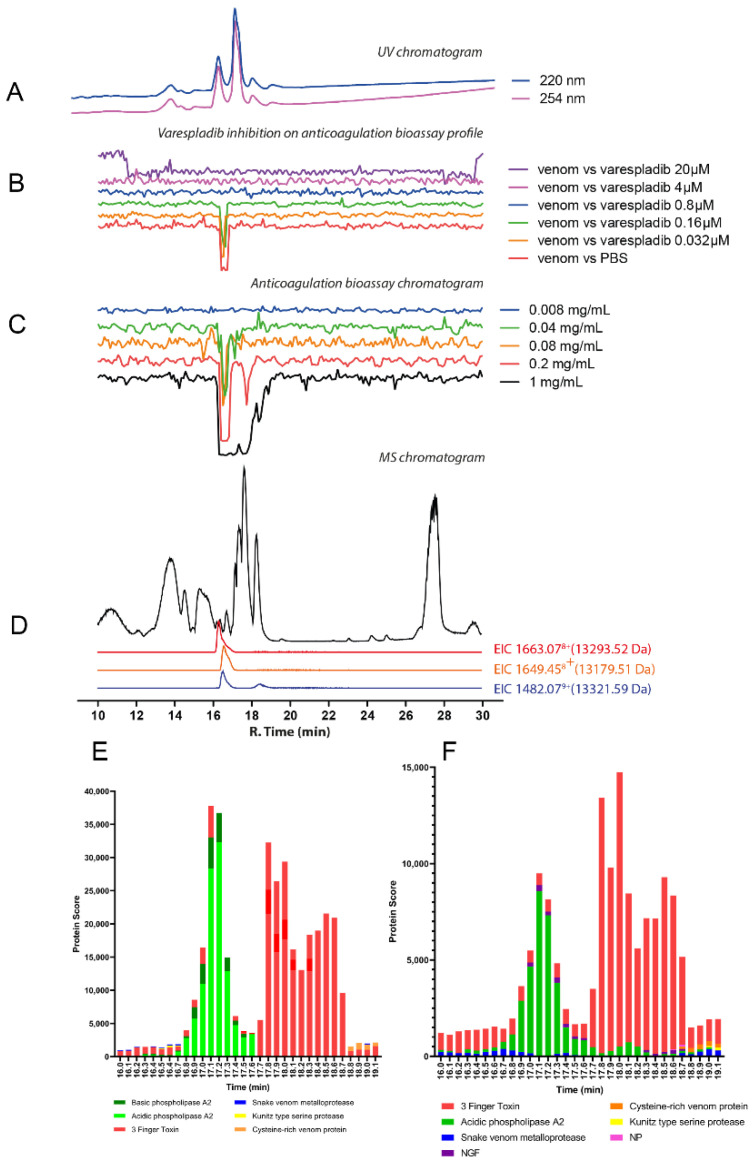
Figure 6.
Correlation of LC-UV and MS chromatogram and bioassay chromatogram of N. naja venom. (A) UV chromatogram of N. naja venom (1 mg/mL, 50 μL injection volume, post-column split into 1:9 ratio of which the smaller portion went to UV (220 and 254 nm recorded); and then to MS detection. Superimposed bioassay chromatograms resulting from analyses of N. naja venom (0.2 mg/mL, 50 µL injection volume) in the presence of different concentrations of (B) varespladib. (C) Superimposed anticoagulation bioassay chromatograms resulting from analyses of several diluted N. naja venom samples ranging from 1 mg/mL to 0.008 mg/mL (50 µL per injection). (D) Base peak chromatogram (BPC) and extracted ion currents (XIC) mass spectrometry. Bioassay chromatograms are correlated to UV and MS. Proteomic annotation of N. naja venom using Mascot software against (E) the Swiss-Prot database and (F) species-specific venom gland transcriptomic-derived database.

