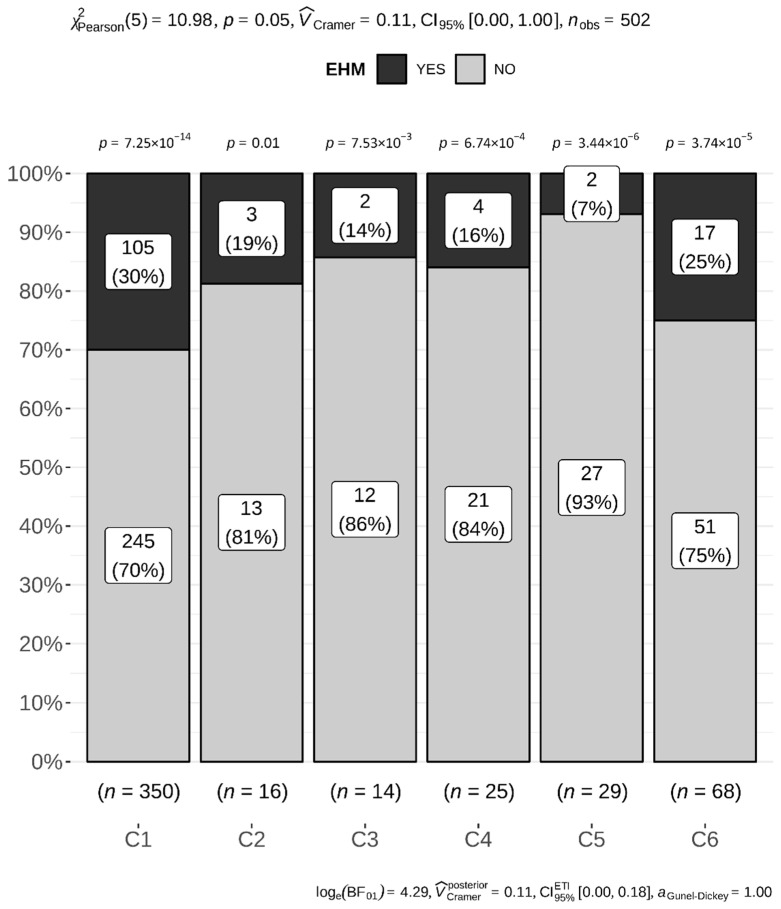
Figure 2.
Six breed clusters (1–6) according to similar genetical background are arranged from left to right. EHM frequencies per cluster are shown as percentage in a stacked bar plot (dark grey). The p-values above distinct stacked bars compare the proportions of EHM-affected (dark gray) individuals versus unaffected (light gray) animals inside of every particular breed cluster. The chi-square test finds only a suggestive relationship between breed clusters and EHM (p = 0.05, low evidence against the null hypothesis). Also, the effect of this relationship is small (VCramer = 0.11 [21]). The Bayes Factor (BF) supports this result by indicating a very strong evidence for the null hypothesis that there is no relationship between EHM and breed (log(BF01) = 4.29 [22]). The Bayesian effect size also supports this conclusion with a small effect size (VCramer = 0.15; 95% Highest Density Intervals 0.09; 0.20).

