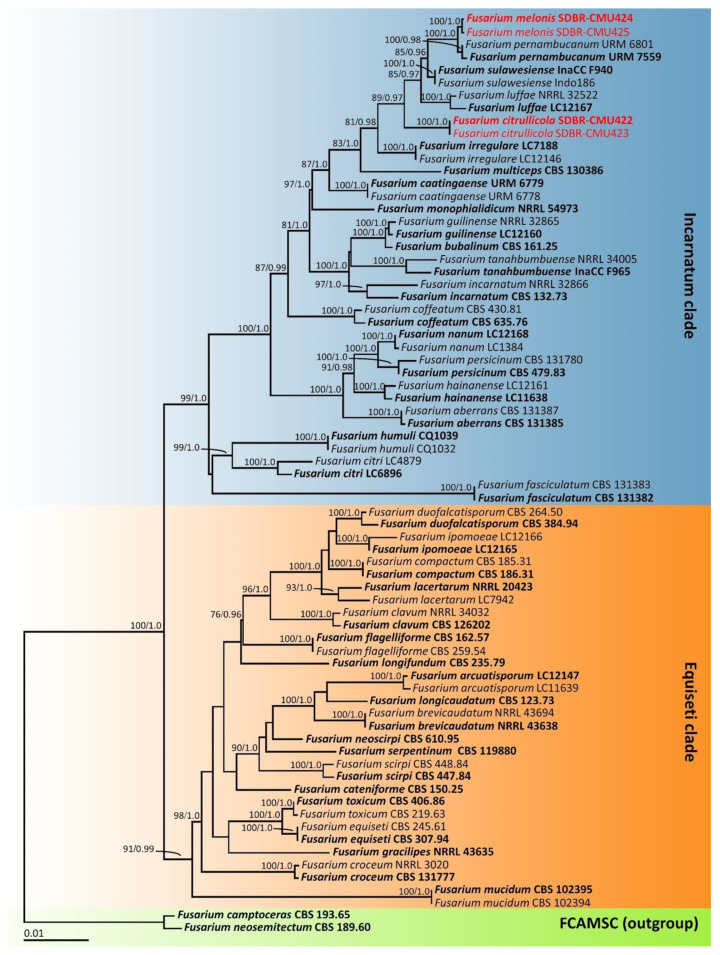
Figure 2.
Phylogram derived from maximum likelihood analysis of 73 taxa of the combined tef-1, cam, and rpb2 sequences. Fusarium camptoceras CBS 193.65 and F. neosemitectum CBS 115476 were used as the outgroup. The numbers above branches represent bootstrap percentages (left) and Bayesian posterior probabilities (right). Bootstrap values ≥ 75% and Bayesian posterior probabilities ≥ 0.95 are shown. The scale bar represents the expected number of nucleotide substitutions per site. Sequences of fungal species obtained in this study are in red. Type species are in bold.

