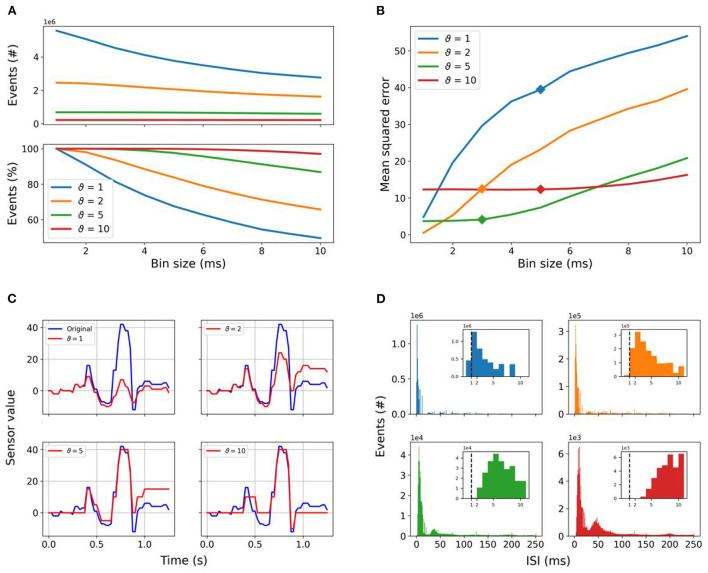
Figure 4.
Spike encoding: (A) Total number of events counted in the whole dataset in dependence of the selected threshold and time_bin_size is shown in the top panel, while the relative amount of events found in the dataset relative to time_bin_size = 1 is reported in the bottom one. Increasing the encoding threshold reduces the number of events significantly, whereas encoding with lower thresholds is much more affected by increasing time_bin_size. The amount of events lost is 50.37% for ϑ = 1, 34.25% for ϑ = 2, 13.17% for ϑ = 5, and only 2.92% for ϑ = 10. (B) MSE values of signal reconstruction after time binning as a function of the time_bin_size for each encoding threshold. The time_bin_size resulting from the HPO and grid search used to preprocess the event stream are highlighted by the markers. Panel (C) shows the reconstruction of the frame-based signal from the event stream for all given thresholds after time binning with a bin size of 5 ms. (D) Number of events as a function of the interspike interval (ISI) with fixed time_bin_size as reported in Table 2, with the same color coding as in (A,B). The insets show the detail at ISI values equal to the time_bin_size used in this work, highlighting the minimum temporal resolution of 1 ms with the vertical dashed line. Spikes below 1 ms in percentage of total number of spikes: 8.22% for ϑ = 1, 0.45% for ϑ = 2, 0% for ϑ = 5, and ϑ = 10.

