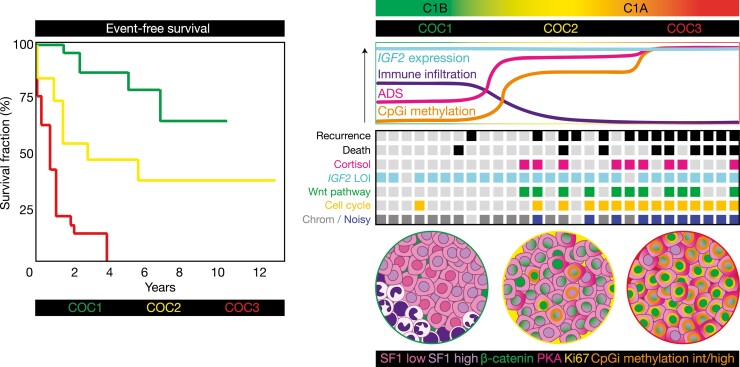
Figure 4.
Adrenocortical carcinoma (ACC) is composed of 3 homogeneous molecular subtypes associated with distinct clinical outcomes. Multiplatform profiling in ACC-TCGA (23) revealed that ACC is composed of 3 molecular subtypes: COC1, COC2, and COC3. COC1 ACC is associated with favorable clinical outcomes (few recurrences and deaths in this group, longest event-free and overall survival), COC2 is associated with intermediate outcomes, and COC3 is associated with dismal clinical outcomes (accounting for up to 40% of all ACC but nearly 70% of recurrences and more than half of deaths) (4, 23). COC2-COC3 ACC are associated with clinically significant cortisol production. On a molecular level, virtually all ACC is characterized by loss of imprinting (LOI) leading to constitutive expression of IGF2; however, COC1-COC3 possess distinct somatic alteration profiles and differential immune infiltration, expression of adrenal differentiation score (ADS) and methylation of CpG islands (CpGi). COC1 ACC possess a higher degree of immune infiltration, lower ADS, minimal CpGi methylation, no recurrent driver somatic alterations, and a chromosomal somatic copy number alteration (SCNA) profile. COC2 ACC also possess a chromosomal SCNA profile. COC2-COC3 ACC are characterized by frequent driver somatic alterations leading to constitutive activation of the Wnt pathway. COC2-COC3 ACC also possess higher ADS (with COC3 ACC at the higher end of this spectrum), suggesting that Wnt pathway activation in these tumors facilitates steroidogenesis. COC3 ACC possess the highest degree of cell cycle activation, enriched for driver alterations promoting constitutive cell cycle activation, and possess a noisy SCNA profile. COC2 ACC possess intermediate levels of CpGi methylation (CIMP-int) while COC3 ACC possess high levels of CpGi methylation (CIMP-high), suggesting that these classes of ACC are characterized by profound disruption in epigenetic patterning. Example event-free survival curves adapted from ACC-TCGA are depicted left. Molecular features are depicted right in the curves (top panel), theoretical heat map (middle panel, columns represent patients; light gray squares indicate “null values,” eg, no recurrence, death, mutation, cortisol production or a quiet SCNA profile, while colored squares indicate the presence of the abnormality), and pseudomicroscope images depict tumor genetic, epigenetic, and cell type heterogeneity (bottom panel).

