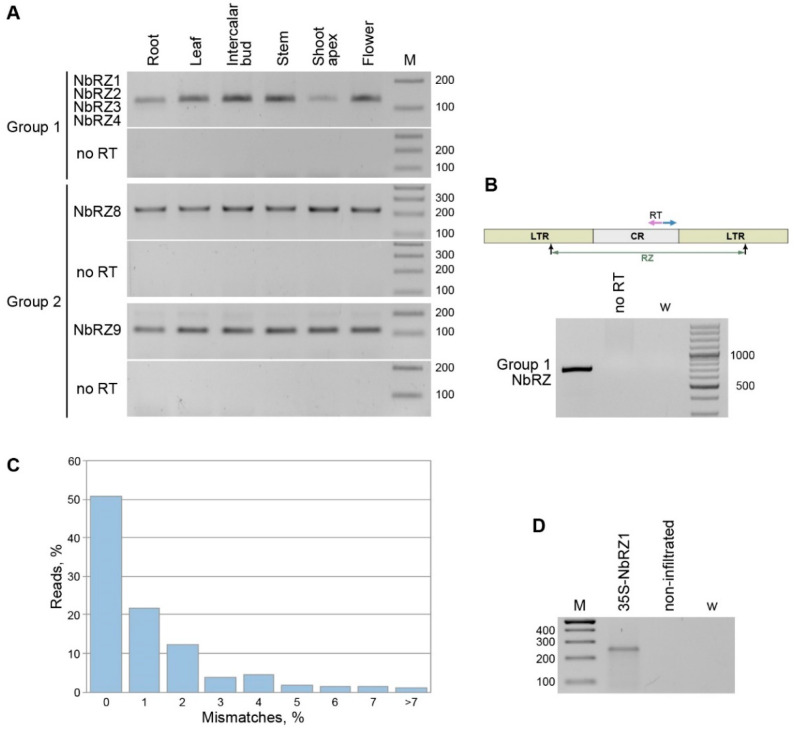
Figure 2.
Analysis of retrozyme RNA in N. benthamiana plants. (A) Detection of retrozymes RNA in different plant parts, which are indicated above the gel. The specificity of the primers used and the retrozyme groups analyzed are indicated on the left. M—DNA size markers. (B) Percentage of retrozyme-specific reads with different numbers of mismatches with the closest genomic sequences. (C) Detection of full-length circular/concatemeric retrozyme RNA with a pair of divergent primers specific for Group 1 NbRZ. Positions of primers are shown by arrows on the retrozyme schematic representation above the gel. RT indicates the primer used for reverse transcription. (D) 5′-RACE analysis of NbRZ1-specific linear RNA in N. benthamiana leaves infiltrated with agrobacteria carrying the 35S-NbRZ1 construct and non-infiltrated leaves. W (water)—a control PCR without template added. M—DNA size markers.

