Figure 3.
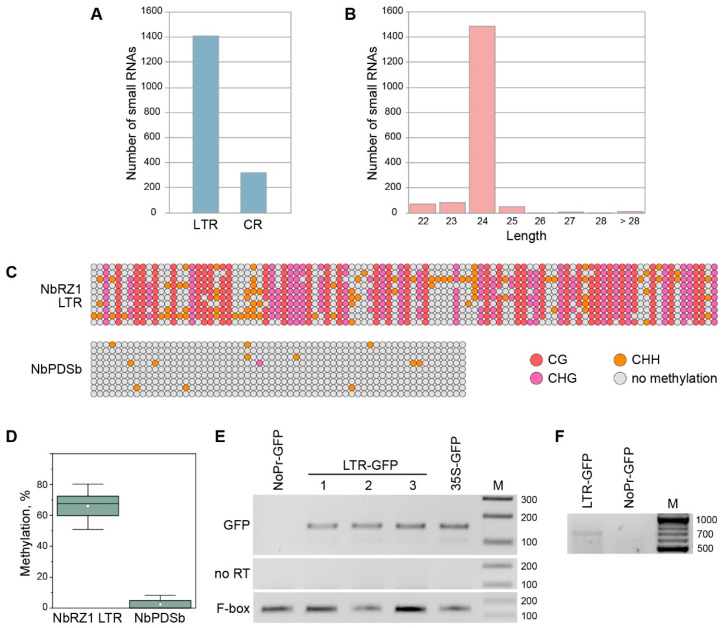
Silencing and transcription of retrozyme genomic loci. (A) Distribution of retrozyme-specific small RNAs between the CR and LTR regions. (B) Length distribution of retrozyme-specific small RNAs. Length in nucleotides is indicated. (C) Bisulfite sequencing analysis of cytosine methylation of the LTR region of the NbRZ1 genomic locus. A region of the NbPDSb promoter was analyzed in parallel as a control. Each row of circles represents one sequenced clone and shows cytosine residues in the analyzed regions as circles. Nonmethylated cytosine residues are shown in gray, and methylated cytosine residues are shown in color, as indicated. (D) Percentage of methylated cytosine residues in the NbRZ1 LTR region. The box represents the interquartile range (IQR), the horizontal line represents the median, white squares show the mean, and whiskers show the range within 1.5 IQR. (E) Analysis of the ability of the NbRZ1 LTR region to direct transcription. Total RNA from N. benthamiana leaves agroinfiltrated for the expression of constructs indicated above the gel was analyzed by RT–PCR. No RT—amplification carried out without reverse transcription. Primer specificity is indicated on the left. F-box primers were used as a control. (F) 5′-RACE analysis of RNA isolated from N. benthamiana leaves infiltrated with agrobacteria carrying either the LTR-GFP construct or the NoPr-GFP construct. M—DNA size markers.

