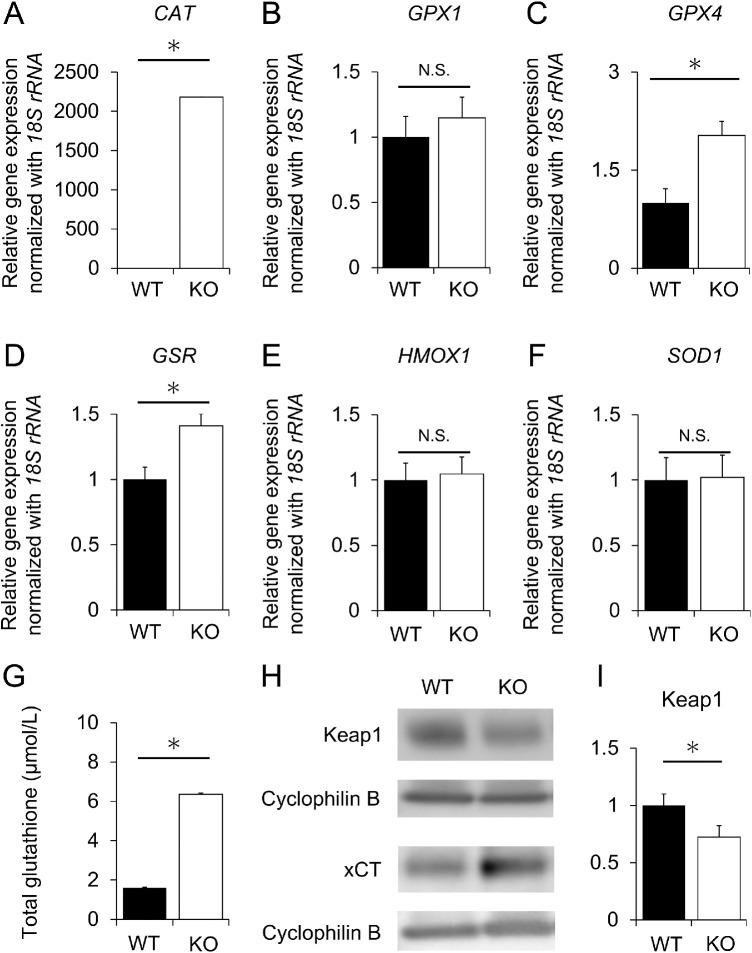
Figure 4.
Expression of oxidative stress marker genes in WT and KO RPE as revealed by qPCR, glutathione assay and Western blotting. Relative expression levels of CAT (A), GPX1 (B), GPX4 (C), GSR (D), HMOX1 (E), and SOD1 (F). 18S rRNA was used as an internal control. The expression level of each gene in WT hiPSC-RPE cells was set as 1. (G) Quantitative comparison of total glutathione levels. (H, I) Protein expression of Keap 1 and xCT. (n = 6, each for WT or KO in A-F, n = 3, each for WT and KO in G, n = 7 each for WT or KO in I). Data are shown as the mean ± SEM. *P < 0.05 (Student's t test). N.S., not significant.

