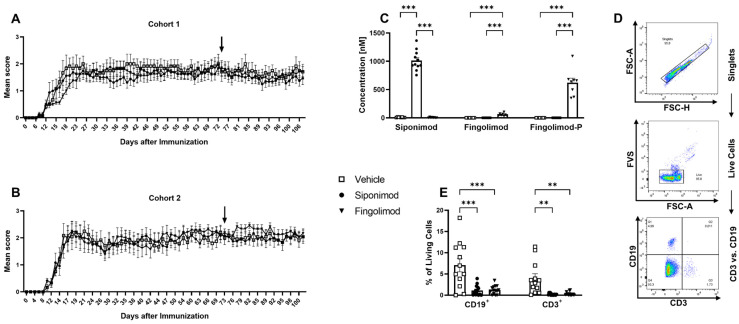
Figure 1.
Development of experimental autoimmune encephalomyelitis in different treatment cohorts and validation of treatment success. Female C57BL/6J mice (9–12 weeks old) were immunized with MP4. (A,B) Disease course in two independent EAE cohorts. Arrows mark the beginning of siponimod or fingolimod treatment. (C) Thirty days after treatment initiation, serum samples were analyzed using mass spectrometry to determine siponimod, fingolimod, and fingolimod phosphate (fingolimod-P) concentrations. (D) Gating strategy for flow cytometry analysis of whole blood 30 d after treatment onset, which is shown in (E). Forward scatter height (FSC-H) vs. forward scatter area (FSC-A) was used to identify singlets. A fixable viability stain (FVS) was used to exclude dead cells. CD3 vs. CD19 comparison showed T (CD3+, CD19−), B (CD3−, CD19+), double negative, and double positive cells. Statistical analysis was performed using two-way ANOVA. ** p < 0.01; *** p < 0.001. EAE = experimental autoimmune encephalomyelitis, fingolimod-P = fingolimod phosphate, FCS-A = forward scatter area, FSC-H = forward scatter height, FVS = fixable viability stain, ANOVA = analysis of variance.

