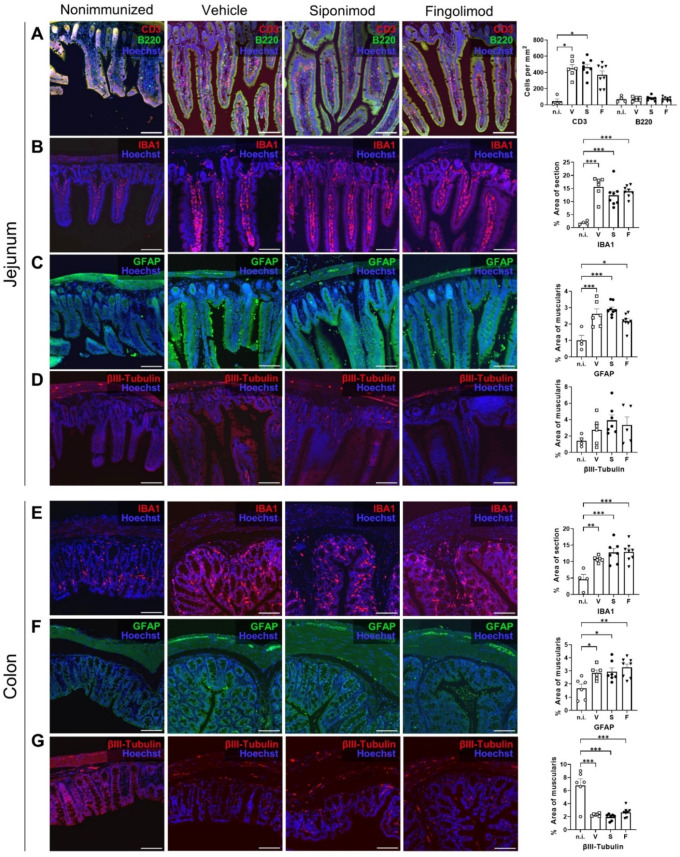
Figure 4.
Immunohistochemical (IHC) staining of the jejunum and colon in siponimod- or fingolimod-treated experimental autoimmune encephalomyelitis (EAE) mice. IHC staining of (A–D) jejunum and (E–G) colon from nonimmunized (n.i.) versus chronic EAE mice treated with siponimod (S), fingolimod (F), or vehicle (V) and corresponding quantitative analysis. (A) Lamina propria infiltrating B and T cells were counted. (B,E) IBA1+ area was measured and compared with whole section area. (C,F) GFAP+ area was measured and compared with the muscularis area. (D,G) βIII-tubulin+ area was measured and compared with the muscularis area. Scale bars represent 100 µm. Statistical analysis was performed using one-way ANOVA with Tukey’s (IBA1, GFAP, and βIII-tubulin) or the Kruskal–Wallis (CD3) post hoc test. * p < 0.05; ** p < 0.01; *** p < 0.001. IBA1 = ionized calcium-binding adapter molecule 1, GFAP = glial fibrillary acidic protein, n.i. = nonimmunized, V = vehicle, S = siponimod, F = fingolimod, ANOVA = analysis of variance.

