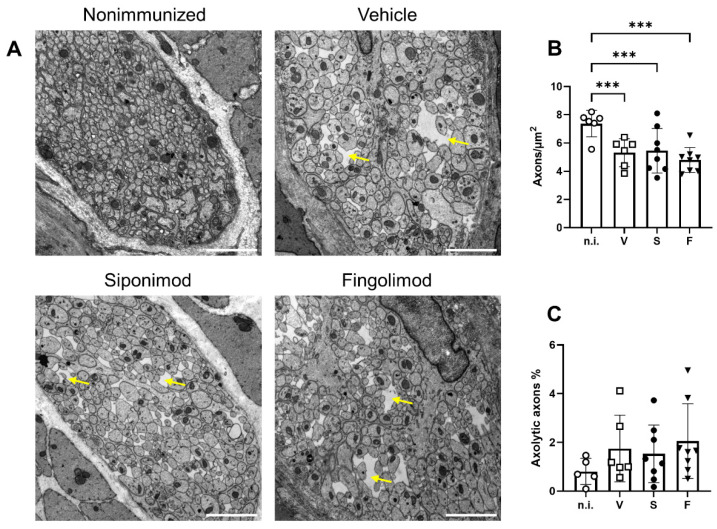
Figure 5.
Analysis of the myenteric plexus in the colon of MP4-immunized mice using transmission electron microscopy. (A) Representative images of each treatment group in 10,000× magnification. Scale bars represent 2 µm. Yellow arrows indicate edematous gaps. (B) Quantification of the number of axons/µm2. (C) Quantification of the percentage of axolytic axons. Statistical analysis was performed using two-way ANOVA. *** p < 0.001. n.i. = nonimmunized, V = vehicle, S = siponimod, F = fingolimod, ANOVA = analysis of variance.

