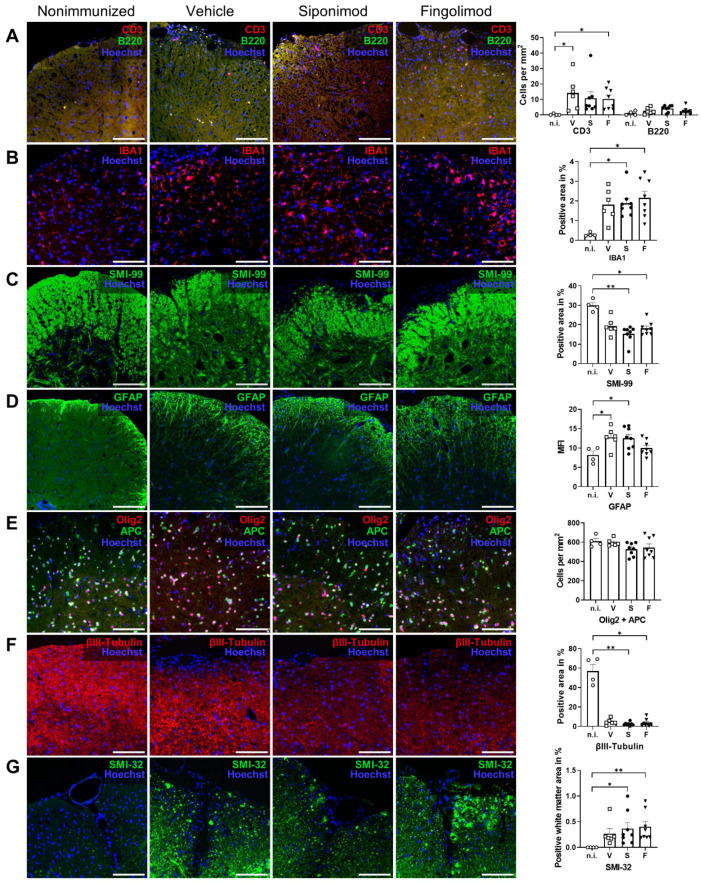
Figure 7.
Immunohistochemical (IHC) staining of spinal cord sections of siponimod- or fingolimod-treated experimental autoimmune encephalomyelitis (EAE) mice. IHC staining of spinal cord sections from nonimmunized (n.i.) vs. chronic EAE mice treated with siponimod (S), fingolimod (F), or vehicle (V). Representative images of each treatment group and corresponding quantification. (A) Spinal cord infiltrating B and T cells were counted, (B) IBA1+ and (C) SMI-99+ area was measured and compared with the whole spinal cord section area, (D) mean fluorescence intensity (MFI) of GFAP staining was determined, (E) Olig2 + APC double-positive cells were counted, (F) βIII-tubulin+ area was measured and compared with the whole spinal cord section area, and (G) SMI-32+ area in the white matter was measured and compared with the white matter area. Scale bars represent 100 µm. Statistical analysis was performed using one-way ANOVA with either Tukey’s (GFAP, Olig2 + APC) or the Kruskal–Wallis (CD3 + B220, IBA1, SMI-99, βIII-tubulin, and SMI-32) post hoc test. * p < 0.05; ** p < 0.01. EAE = experimental autoimmune encephalomyelitis, GFAP = glial fibrillary acidic protein, MFI = mean fluorescence intensity, n.i. = nonimmunized, S = siponimod, F = fingolimod, V = vehicle, MBP = myelin basic protein, ANOVA = analysis of variance.

