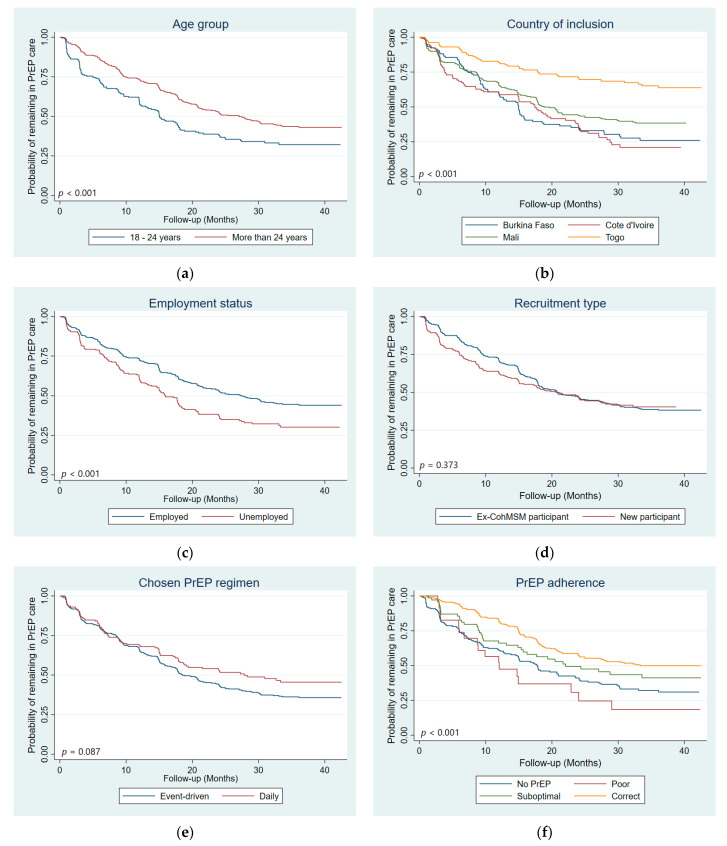
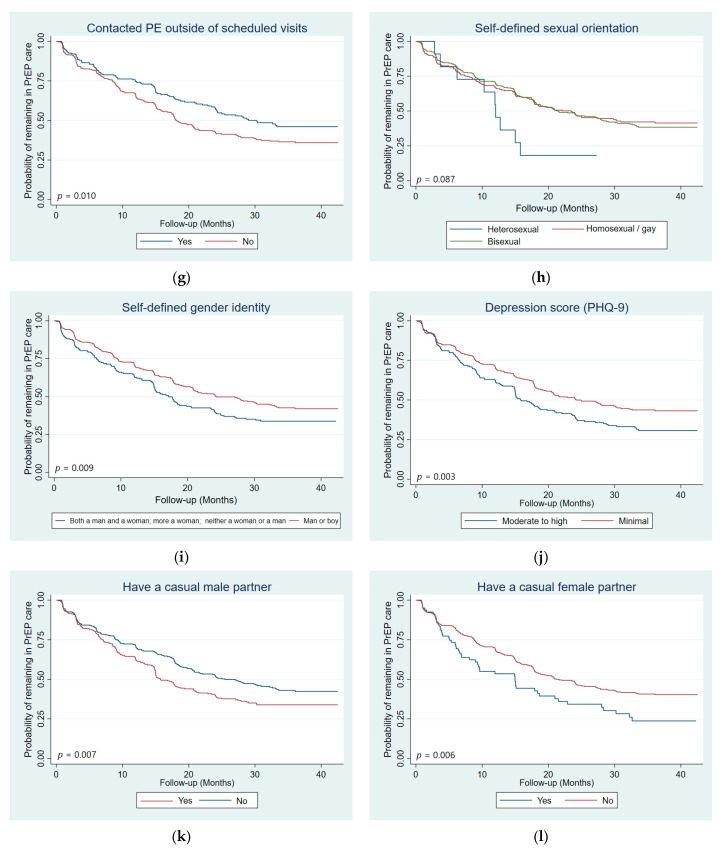
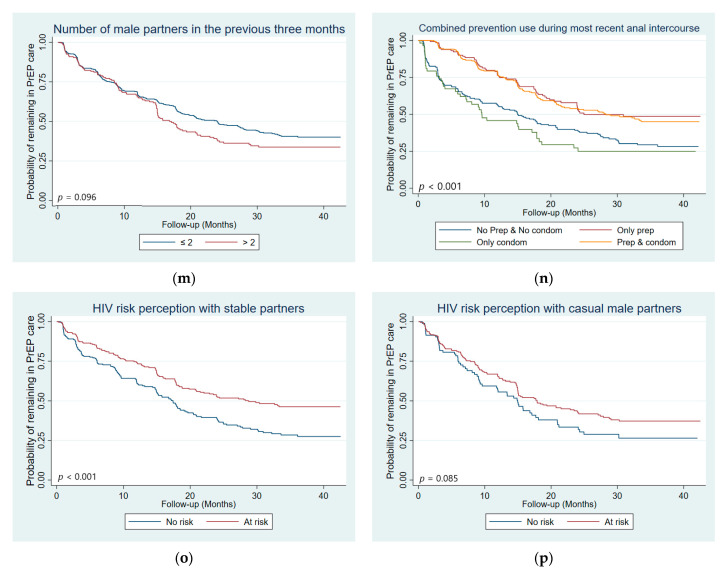
Figure 2.
Kaplan–Meier curves with log-rank test p-value comparing LTFU by: (a) age group, (b) country, (c) employment status, (d) recruitment type, (e) chosen PrEP regimen, (f) PrEP adherence, (g) contact with peer educators outside of scheduled visits, (h) self-defined sexual orientation, (i) self-defined gender identity, (j) depression score, (k) had a casual male sexual partner in the previous three months, (l) had a casual female sexual partner in the previous three months, (m) number of male sexual partners in the previous three months, (n) Combined prevention use during most recent anal intercourse, (o) HIV risk perception with stable male partner, and (p) HIV risk perception with casual male partners (n = 647 participants, 4831 visits).


