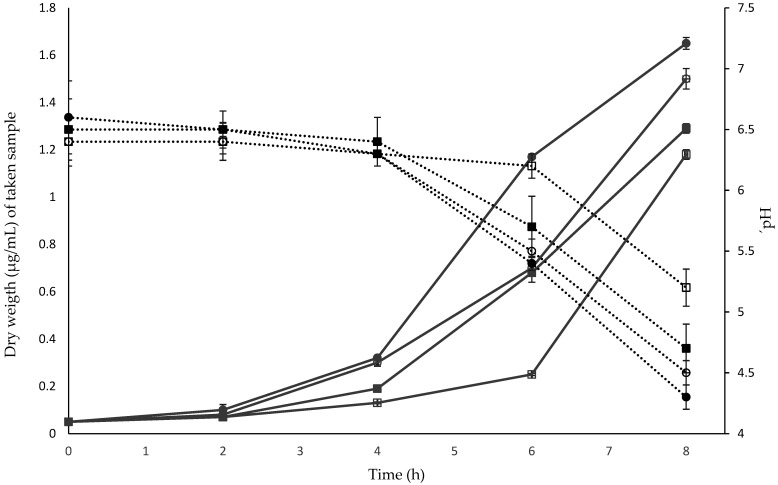
Figure 4.
Effect of different carbon sources on the growth of B. pseudocatenulatum JCLA3. Continuous lines in grey correspond to the biomass obtained, and dotted lines in black indicate changes in pH regarding different carbon sources. ○ glucose (control); ● sucrose; ■ inulin; □ lactose; and pH of the medium along time.

