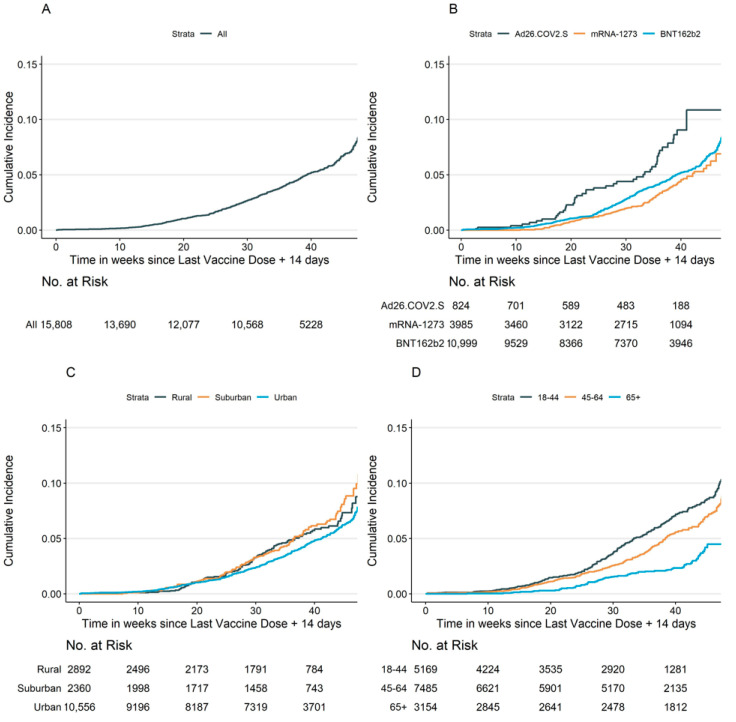
Figure 1.
Cumulative incidence curves of breakthrough infection among participants who reported full vaccination (1 minus the unadjusted Kaplan–Meier risk). Below each graph is the number at risk at each time point for the first self-reported symptomatic positive SARS-CoV-2 test, starting from full vaccination: (A) Overall; (B) By vaccine product; (C) By county classification; (D) By age stratum.

