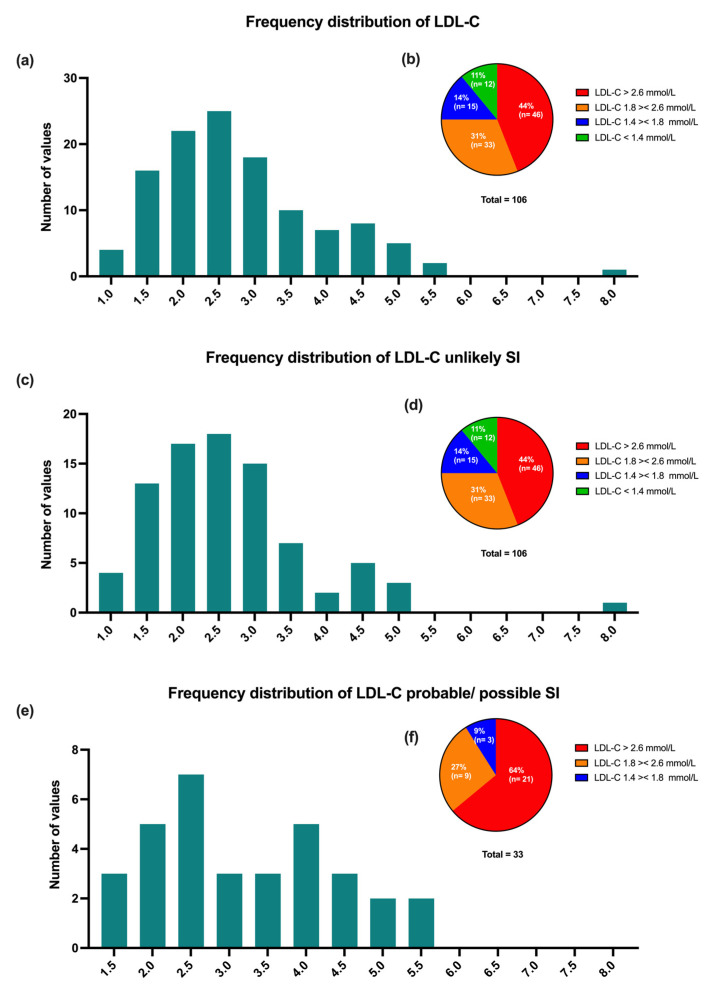
Figure 2.
Patients with controlled LDL-C (a,c,e) and percentage of different LDL-C objective values (b,d,f) for different SI subgroups (all SI patients (a,b), unlikely statin intolerance (c,d), or probable/possible statin intolerance (e,f)). Data are presented as absolute numbers/percentages (n/N). LDL-C, low-density lipoprotein cholesterol.

