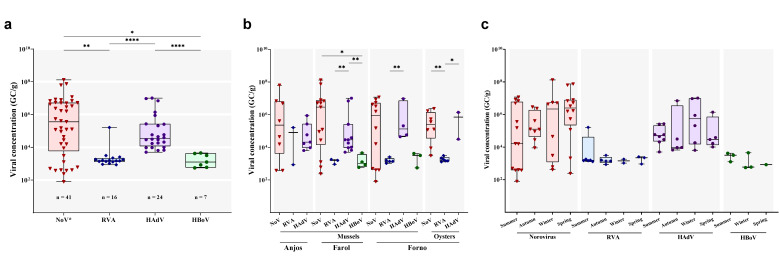
Figure 2.
(a) Overall variation of enteric viruses’ concentration in bivalve samples and the viral load of enteric viruses by (b) sampling site and (c) season. Box and whisker plots show the first and third quartiles (equivalent to the 5th and 95th percentiles), the median (horizontal line in the box) and range concentrations [genome copies per gram (GC/g) of digestive tissue]. * p ≤ 0.05; ** p ≤ 0.01; **** p ≤ 0.0001.

