Figure 1.
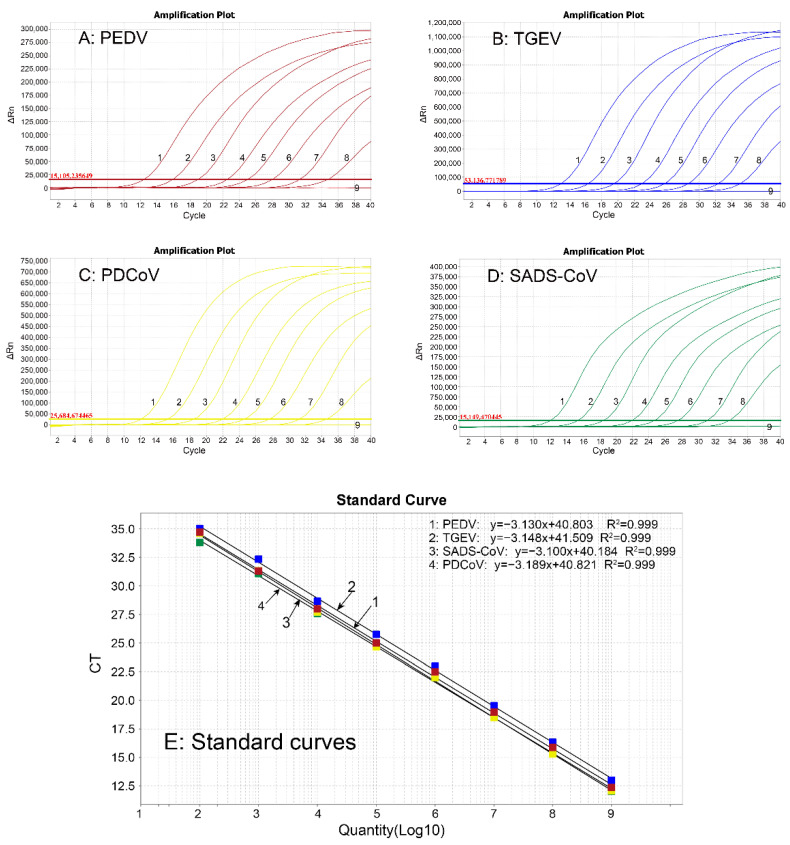
Generation of the standard curves. The amplification curves were generated from the standard plasmid p-PEDV (A), p-TGEV (B), p-PDCoV (C), and p-SADS-CoV (D) with different concentrations from 1.21 × 10⁹ to 1.21 × 10² copies/μL (final reaction concentration: 1.21 × 10⁸ to 1.21 × 101 copies/μL), respectively. The standard curves (E) showed excellent linear relationship (R2 ≥ 0.999) between logarithm of templates and their Ct values.

