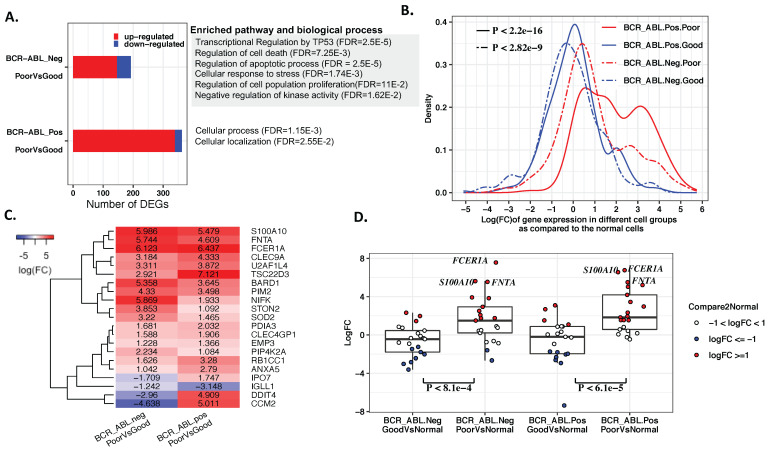
Figure 2.
Comparisons of the stem cells from distinct TKI responders. (A) The gene expression markers that differentiate the cells of good and poor responders in BCR-ABL− and BCR-ABL+ cell groups. Most gene markers were upregulated in the cells of poor responders. TKI response markers were enriched in multiple biological processes and pathways related to cancer development and drug resistance for the BCR-ABL− cell group, while similar function disruptions were not observed in BCR-ABL+ stem cells. (B) The distribution of expression changes of the response gene markers in the individual cell groups as compared with the normal HSCs. The red curves correspond to expression change in the cells of the poor responders, while the blue curves are for good responders. (C) The major TKI response marker genes shared by BCR-ABL− and BCR-ABL+ stem cells had higher expression in the cells of poor responders than good responders. (D) The expression changes of the common gene markers as compared to the normal HSCs. S100A10, FCER1A, and FNTA had the largest expression increase in the cells of TKI poor responders. These genes showed more elevated expression levels in the both BCR-ABL+ (p < 6.1 × ) and BCR-ABL− (p < ) stem cells from poor responders than from good responders.

