Figure 2.
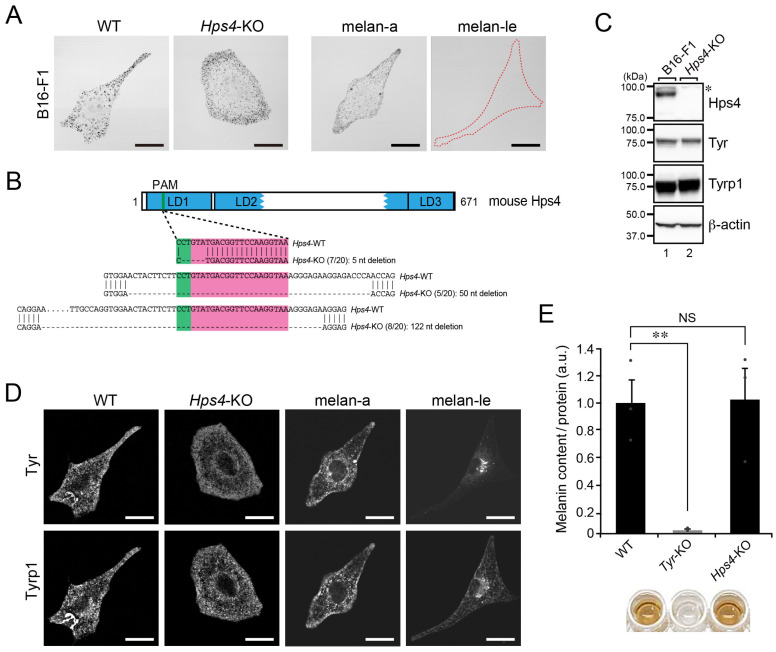
Black-pigmented melanosomes are formed in B16-F1 cells, even in the absence of Hps4. (A) Representative bright-field images of WT B16-F1 cells, Hps4-KO B16-F1 cells, melan-a cells, and Hps4-deficient melan-le cells. The melan-le cell devoid of black-pigmented melanosomes is outlined with a broken red line. Scale bars, 20 μm. (B) Domain organization of the mouse Hps4 protein and genomic mutations in Hps4-KO cells. The Cas9 target and PAM sequences are highlighted in magenta and green, respectively. Genomic PCR products containing the target site were subcloned into the pGEM-T Easy vector, and then 20 colonies (denominators of the fractions in parentheses) were picked up at random and their inserts were sequenced. The numerators of the fractions in the parentheses are the numbers of colonies obtained by sequencing the subcloned PCR products. LD1–3, longin domain 1–3. (C) Expression of Hps4 in WT cells and Hps4-KO B16-F1 cells as determined by immunoblotting with the antibodies indicated. The asterisk indicates a nonspecific band. (D) Representative images of Tyr and Tyrp1 in WT B16-F1 cells, Hps4-KO B16-F1 cells, melan-a cells, and Hps4-deficient melan-le cells. Their bright-field images are shown in (A). Scale bars, 20 μm. (E) Quantification of the melanin content (i.e., optical density at 490 nm) in WT cells, Tyr-KO cells, and Hps4-KO B16-F1 cells. The graph shows the means and SEM of the data obtained in three independent experiments. **, p < 0.01; NS, not significant (Tukey’s test).

