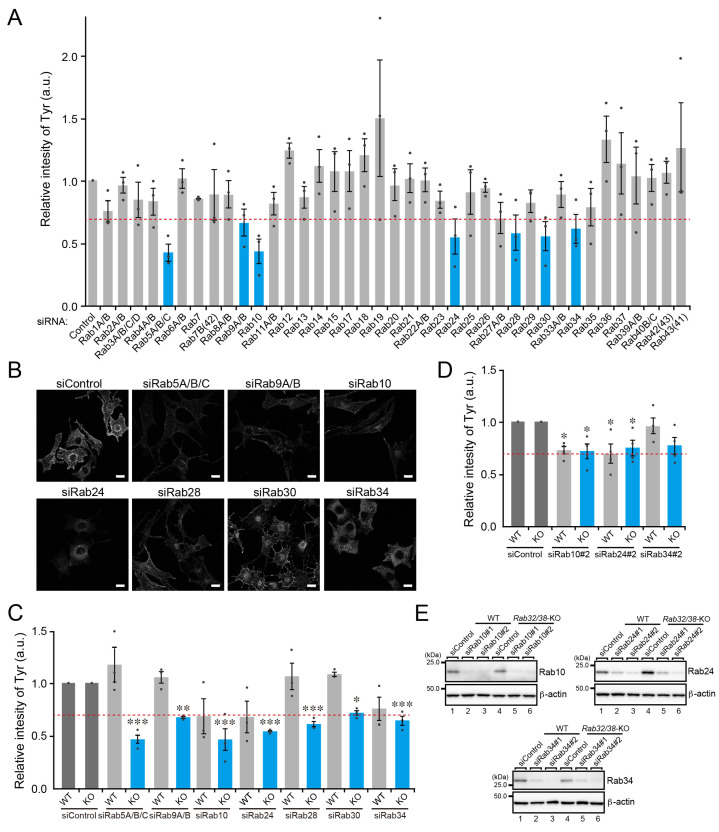
Figure 6.
Comprehensive screening for Rabs whose KD resulted in a reduction in Tyr signals in Rab32/38-KO B16-F1 cells. (A) Relative intensity of Tyr in Rab32/38-KO cells transfected with control siRNA or siRNA against each Rab subfamily was determined by a quantitative immunofluorescence analysis. Error bars indicate the SEM of the data obtained in three independent experiments (n > 10 cells in each experiment). The broken red line indicates a 30% reduction in Tyr signals. The blue bars represent the seven candidate Rabs whose KD resulted in a more than 30% reduction in Tyr signals in comparison with the control siRNA. KD of these candidate Rabs was confirmed by RT-PCR analysis (see Figure S2). (B) Typical images of Tyr in the candidate Rab-KD cells shown in (A). Scale bars, 20 μm. (C) Relative intensity of Tyr in WT cells (light gray bars) and Rab32/38-KO B16-F1 cells (blue bars) transfected with control siRNA or siRNA against each candidate Rab shown in (A), as determined by quantitative immunofluorescence analysis. Error bars indicate the SEM of the data obtained in three independent experiments (n > 10 cells for each experiment). The broken red line indicates the 30% reduction of Tyr signals. *, p < 0.05; **, p < 0.01; ***, p < 0.001 in comparison with the results obtained with the control siRNA (Dunnett’s test). (D) Relative intensity of Tyr in WT cells (light gray bars) and Rab32/38-KO B16-F1 cells (blue bars) transfected with control siRNA or siRNA#2 against Rab10, Rab24, and Rab34. Error bars indicate the SEM of the data obtained in four independent experiments (n > 20 cells for each experiment). The broken red line indicates the 30% reduction of Tyr signals. *, p < 0.05 in comparison with the results obtained with the control siRNA (Dunnett’s test). (E) KD efficiency of siRNAs toward Rab10, Rab24, and Rab30 as revealed by immunoblotting with the specific antibodies indicated.

