Figure 1.
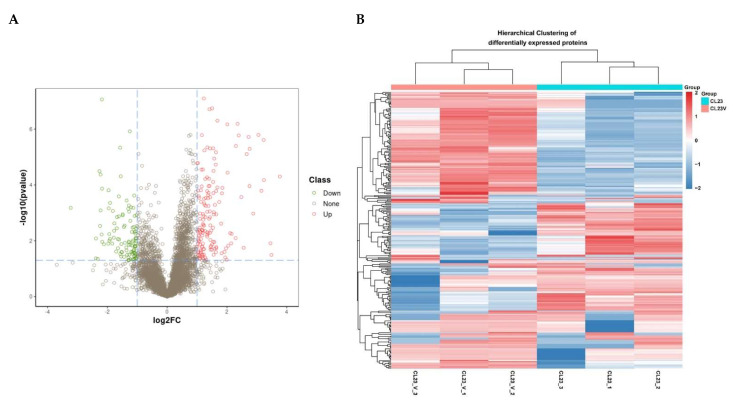
Proteomic - analysis of MDCK cells infected with Influenza A virus (IAV) H1N1 relative to uninfected MDCK cells. (A) The volcano plot represents the significance and magnitude of protein level changes in uninfected MDCK cells (MDCK mock) and IAV H1N1-infected MDCK cells 16 h post infection (hpi) (MDCK H1N1 16 hpi). Green dots represent downregulated differentially expressed proteins, red dots represent upregulated differentially expressed proteins, and “None” represents proteins with no significant expression differences between the two groups of cells. (B) The heat map represents significant protein differences between MDCK mock and MDCK H1N1 16 hpi cells. The color scale indicates the relative protein abundance, with darker shades representing the greatest difference in protein abundance between the two groups; red indicates up-regulation and blue indicates downregulation. The student’s t-test was used to identify statistical significance.

