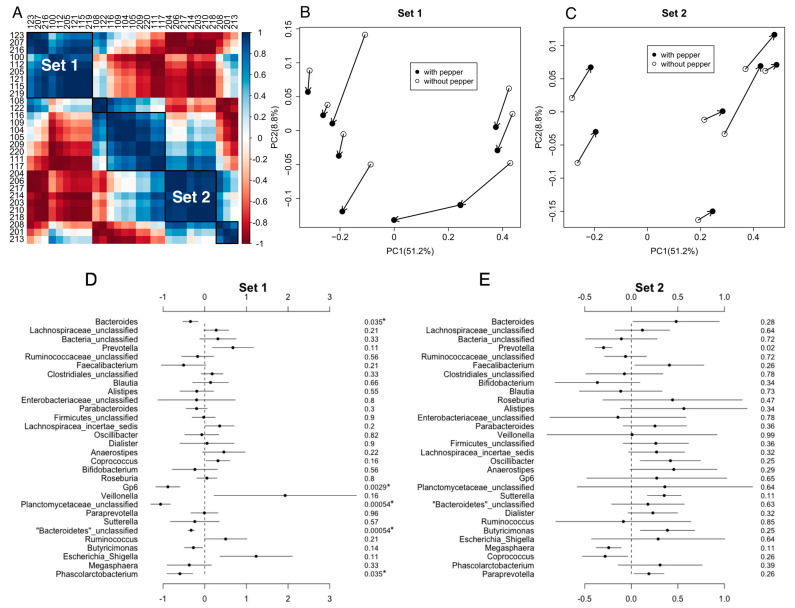
Figure 4.
Beta Diversity of gastrointestinal bacterial communities by clustering the gut microbiota with similar microbiota community shifts upon consumption of CP. (A) Some participants (n = 16) could be binned into one of two groups-based cosine similarities. The remaining participants could not be binned based on cosine similarities. The axes are participant ID. The color gradients represent the cosine similarity. The dark blue is 1, and the dark red is −1. Principle coordinates analysis plots based on Bray–Curtis dissimilarities are shown in (B) Set 1 (n = 9) and (C) Set 2 (n = 7). Black dots represent each participant’s microbiota after consuming CP, whereas open dots represent each participant’s microbiota when not consuming CP. Comparisons of the abundance of the 30 most abundant taxa between CP exposure and non-exposure are shown in (D) Set 1 and (E) Set 2. The solid circle is the estimate of the coefficient, and the line indicates the confidence interval. The number in the right-most column is the FDR adjusted p-value for the statistical comparison. p-values with asterisks are significant, where p-value < 0.05 considered significant. The estimates are reported as the taxa abundance within the “without CP” group minus the taxa abundance in the “with CP” group. If the estimate is negative, the “with CP” group had a higher abundance. If the estimate is positive, the “without CP” group had a higher abundance.

