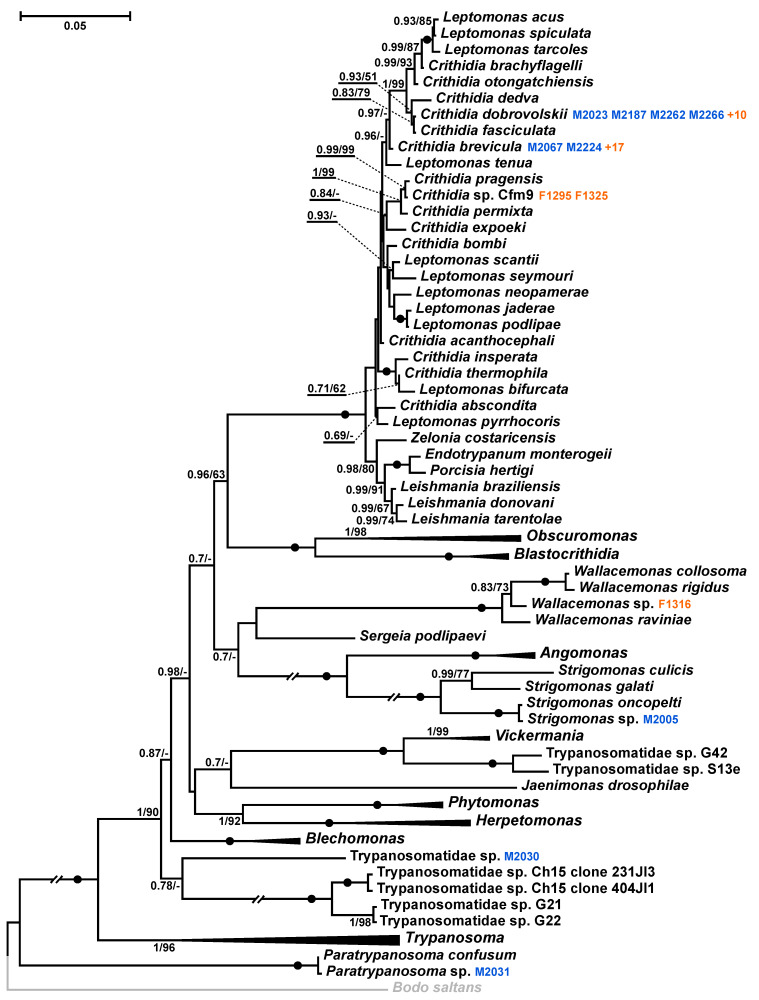
Figure 2.
Maximum likelihood phylogenetic tree based on 18S rRNA gene sequences. Isolates from overwintering mosquitoes are in blue, those from the end of the warm season are in orange (only the total number is shown if it exceeds four). The clades of genera not containing such isolates are collapsed. Posterior probabilities and bootstrap values from maximum likelihood analysis are shown at the nodes (values below 0.5 or 50% are replaced with dashes or omitted). Dots mark branches with maximal support by both methods. The tree was rooted with the sequence of Bodo saltans (Eubodonida) as an outgroup (shown in grey). Double-crossed branches are shortened by 50 %. The scale bar denotes the number of substitutions per site.

