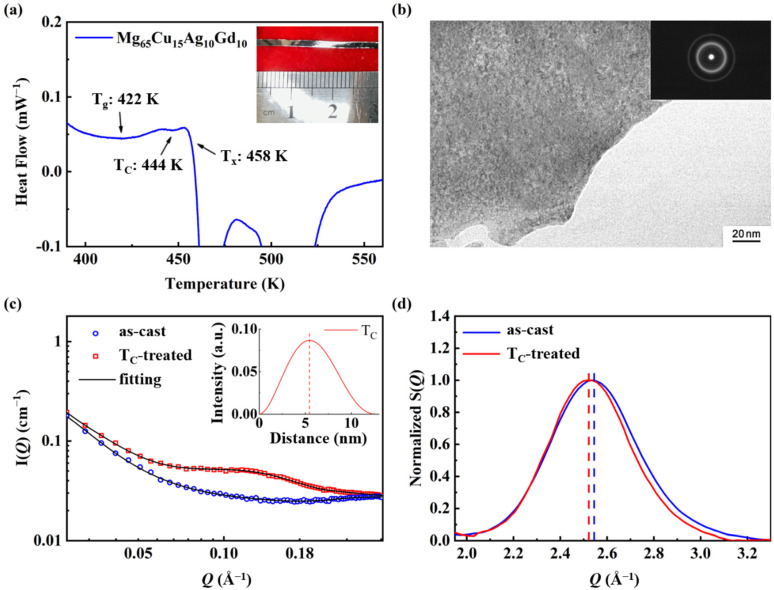
Figure 1.
(a) Differential scanning calorimetry curve of Mg65Cu15Ag10Gd10 amorphous alloy ribbon. The inset is an optical image of an as-cast sample. (b) High-resolution transmission electron microscopy of Mg65Cu15Ag10Gd10 TC-treated ribbon. The inset is the selected area electron diffraction pattern. (c) The SAXS of Mg65Cu15Ag10Gd10 as-cast and TC-treated ribbons. Reproduced with permission [28]. Copyright 2021, Springer Nature. The inset is the size distribution function based on the SAXS profiles. (d) The structure factor of Mg65Cu15Ag10Gd10 as-cast and TC-treated ribbons.

