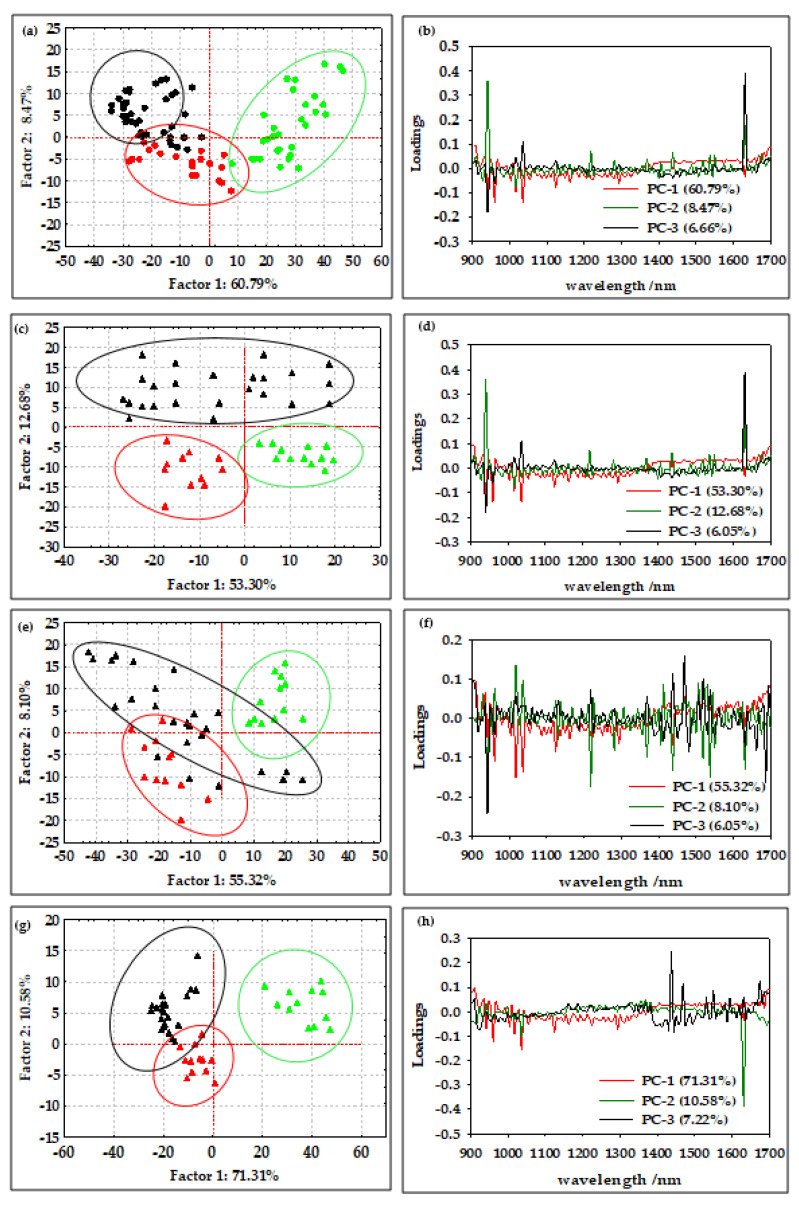
Figure 4.
(a) PCA score plot of all average oil-in-water emulsion NIR spectra after SNV preprocessing ( PEG 1500,
  PEG 6000,
  PEG 20,000). (b) PCA loading of all average oil-in-water emulsion NIR spectra after SNV preprocessing. PCA score plot of NIR spectra of oil-in-water emulsion NIR spectra after SNV preprocessing with (c) PEG 1500, (e) PEG 6000, and (g) PEG 20,000 (
 2% emulsifier,
  4% emulsifier,
  6% emulsifier). PCA loading of NIR spectra of oil-in water emulsion NIR spectra after SNV preprocessing with (d) PEG 1500, (f) PEG 6000, and (h) PEG 20,000.

