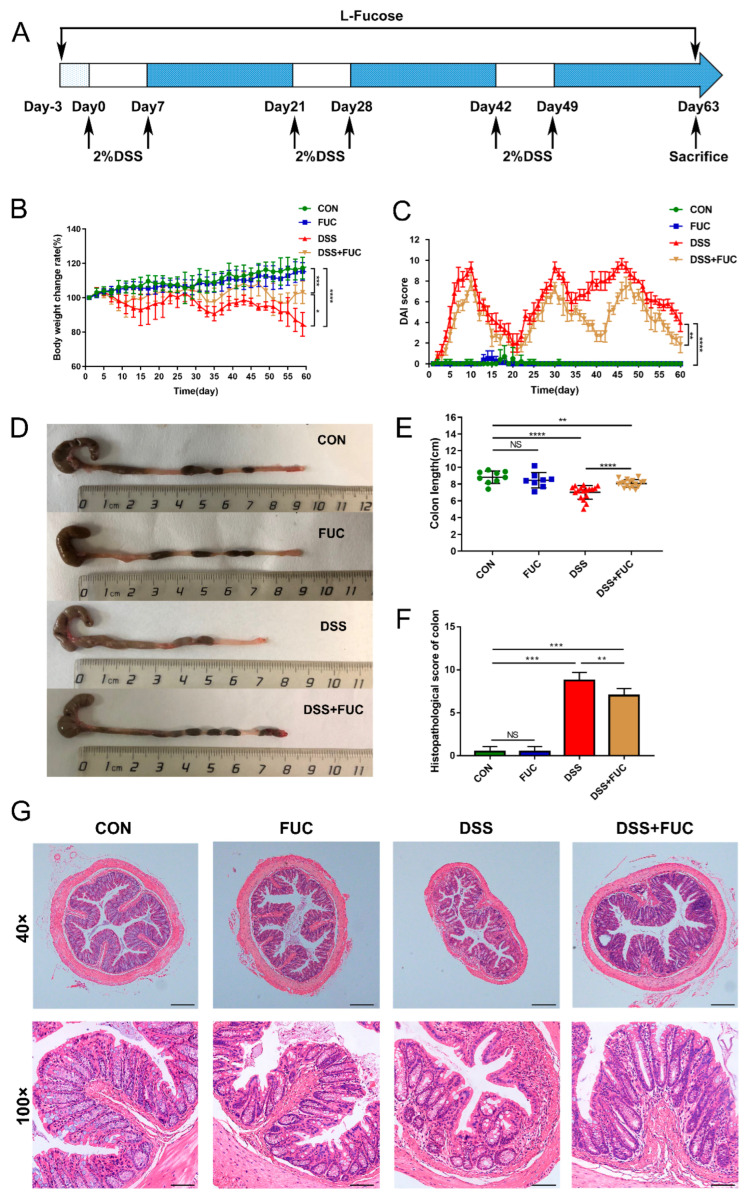
Figure 1.
Amelioration of DSS-induced chronic colitis with L-fucose treatment. (A) Schematic diagram illustrating the experimental design. (B) Body weight percentage changes in each group. (C) Disease activity index (DAI) evaluations. (D) Comparisons of colon length in each group. (E) Quantitative analysis of colon length. (F) Histopathological scores of colons from each group of mice. (G) Representative images of H&E staining of colon sections. Magnification, 40× (above), 100× (below). Data are presented as the mean ± SD. * p < 0.05, ** p < 0.01, *** p < 0.001, **** p < 0.0001; NS, no significance.

