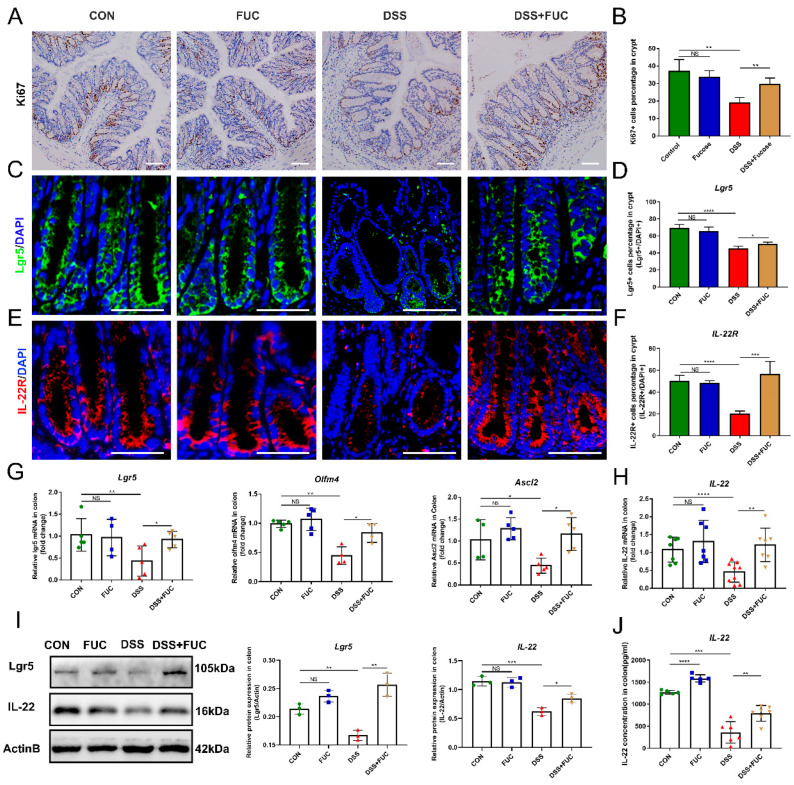
Figure 2.
Increased ISC regeneration and IL-22 secretion in mice treated with L-fucose. (A) Representative images of Ki67 immunohistochemistry of the colon (scale bar, 100 μm). (B) Ki67+ cell percentage in crypts. (C) Representative images of Lgr5 (green) in the colon (scale bar, 50 μm). (D) Lgr5-positive cell percentage in crypts. (E) Representative images of IL-22R (red) in the colon (scale bar, 50 μm). (F) IL-22R-positive cell percentage in crypts. Quantitative reverse-transcriptase polymerase chain reaction (qRT-PCR) analysis of (G) Lgr5, Olfm4, Ascl2 and (H) IL-22 in the colon. (I) Western blotting analysis of Lgr5 and IL-22 proteins in the colon. (J) ELISA analysis of IL-22 in the colon. The scale bar represents 100 μm. Data are expressed as the mean ± SD. * p < 0.05, ** p < 0.01, *** p < 0.001, **** p < 0.0001; NS, no significance.

