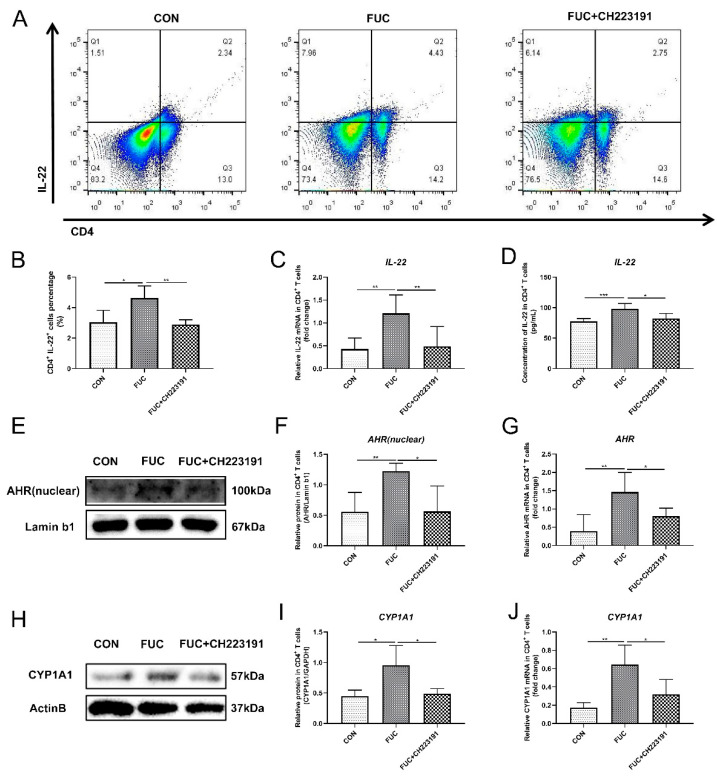
Figure 4.
Increased IL-22 secretion from CD4+ T lymphocytes through AHR activation after L-fucose treatment. (A) Representative flow cytometric profiles of IL-22 secreting CD4+ cells. (B) Percentage of IL-22+ cells in CD4+ T cells. (C) qRT-PCR analysis of IL-22 in CD4+ T cells. (D) ELISA analysis of IL-22 in the culture supernatant of CD4+ T cells. (E) Western blotting analysis of AHR protein in CD4+ T-cell cell nuclei. (F) Quantitative analysis of AHR protein in CD4+ T-cell cell nuclei. (G) qRT-PCR analysis of AHR in CD4+ T cells. (H) Western blotting analysis of CYP1A1 in CD4+ T cells. (I) Quantitative analysis of CYP1A1 protein in CD4+ T cells. (J) qRT-PCR analysis of CYP1A1 in CD4+ T cells. Data are expressed as the mean ± SD. * p < 0.05, ** p < 0.01, *** p < 0.001; NS, no significance.

